From Seville to Brussels: The Architecture of Global Presence
28 Oct 2015
By Iliana Olivié, Manuel Gracia for Elcano Royal Institute of International and Strategic Studies

This article was external pageoriginally published by external pageElcano Royal Institute on 9 October 2015.
Topic
The purpose of this paper is to understand the global-local link in the external projection of countries. It breaks down the Elcano Global Presence Index by geographical origin for both the European Union (into member states) and for one particular European country, namely Spain.
Abstract
Previous analyses by the Elcano Royal Institute emphasise the link between the domestic sphere of a country’s economic, political and social systems and its international projection, as well as the relationship between internal and foreign policies. One way to assess the extent and shape of this complex link is by means of the Elcano Global Presence Index. The index value of the European Union can be disaggregated into economic, military and soft dimensions and variables or from a geographical focus, taking into account the relative contribution of each member state to the Union’s total projection. As for member states, their global presence is the result of the external projection of their regions and communities.
Analysis
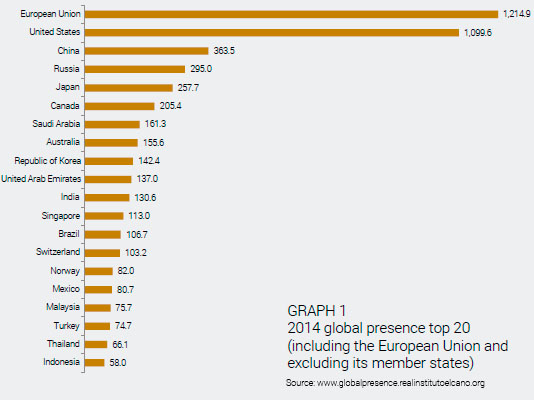
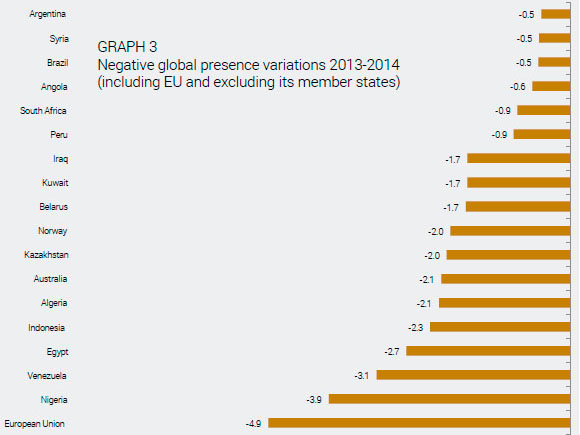
In this edition, as in previous ones, the European Union remains the political unit with the highest global presence. The total external projection of European Union member states outside the Union’s boundaries amounts to 1,214.9 in 2014 (Graph 1). By this measure, the European Union has recorded a decrease (of 4.9 points) in global presence over the past year, as its global presence index amounted to 1,222.3 in 2013. This 0.3% decrease might not seem especially significant, but it is in fact the third sharpest drop recorded by any country or territory during the past year. Iran tops this particular ranking with a 6.7 point decrease, followed by Libya, which records a 6.4 point drop (Graph 3).
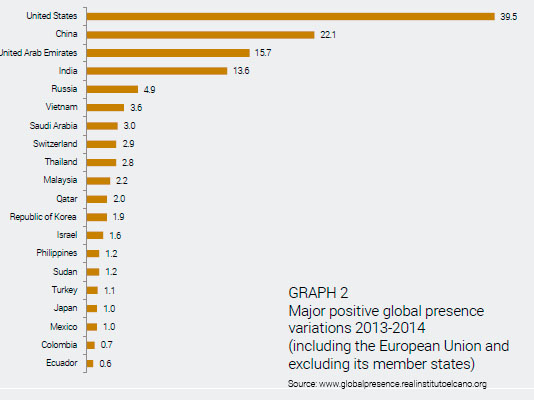
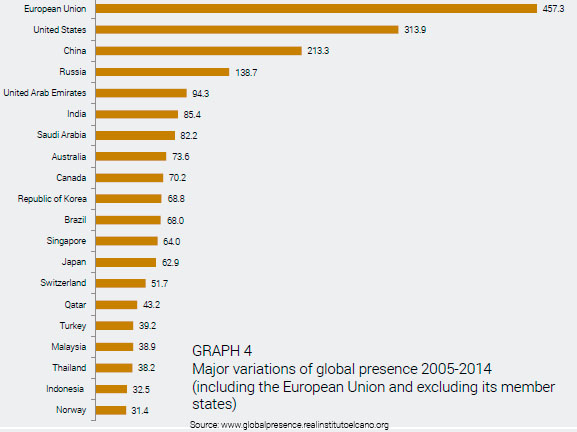
This trend contrasts with that of other countries, including the United States (whose global presence increased by 39.5 points between 2013 and 2014), China (rising 22.1 points) and other emerging economies and middle-sized or regional powers such as the United Arab Emirates (15.7 points), India (13.6), Russia (4.9), Vietnam (3.6) and Saudi Arabia (3.0) (Graph 2). The global presence gap between the European Union and the United States has decreased from 162.2 points in 2013 to 118.0. This is due to a large extent to dollar-euro exchange rate variations, with the euro recording a lower value in 2013 with respect to 2012. This movement has a negative impact on Eurozone countries as well as on countries with national currencies pegged to the euro. However, it should be noted that the European Union is the territory that has recorded the highest increase of total global presence since 2005, the first year for which we calculate European external projection. During the 2005-14 period, the European Union’s global presence has increased by 457 points, compared with 314 points in the case of the United States and 213 for China (Graph 4).
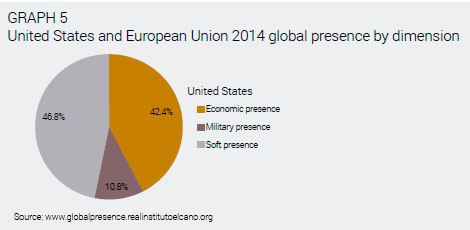
As for the features of the European Union’s global presence, as pointed out previously (Olivié et al., 2014),1 it is mostly based on the soft dimension (which accounts for 52% of its total global presence) and on economic variables (45%). Military presence accounts for less than 3% of Europe’s external projection. These figures contrast with the United States’ global presence composition; despite the decrease in military variables in the 2012-13 period, this dimension still represents over 10% of the country’s total presence. As with the European Union, the most significant dimension for the United States is soft presence, followed by economic (Graph 5).
How is that presence built? The relative contribution of member states to the Union’s external projection
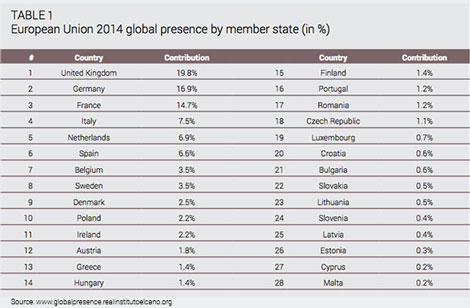
Besides its sector composition, the European Union’s global presence can be analysed geographically. It is possible to calculate to what extent each of the 28 member states contribute to the total external projection of the whole territory. Data for 2014 show that the United Kingdom is the main contributor to Europe’s global projection, followed by Germany, France, Italy, the Netherlands and Spain. The three top countries account for over 51% of Europe’s global presence (Table 1). This ranking has not recorded major changes over the past decade. Actually, the top nine spots in 2014 continue to be held by the same countries –in the same positions– as in 2005.
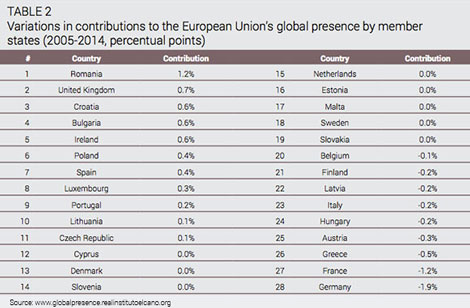
Although the United Kingdom has been strengthening its position since 2005, with an increase of 0.7 points in its contribution to the European Union’s global presence, other major member states record the opposite trend. Noteworthy are the two countries whose contribution decreased most in the 2005-14 period: Germany (by 1.9 points) and France (1.2) (Table 2).2
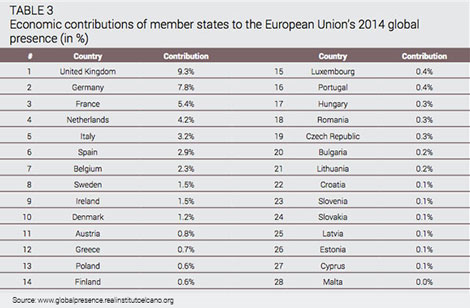
The ranking of economic contributions of member states to the European Union’s global presence shows a similar picture. Five big economies top the ranking: the United Kingdom (9.3% of global presence), Germany (7.8%), France (5.4%), the Netherlands (4.2%) and Italy (3.2%) (Table 3). Moreover, the first three contributors account for approximately half of the aggregated economic contribution to global presence. This might also reflect their capacity to reorient their exports outside the European Union in a period of financial and economic crisis.
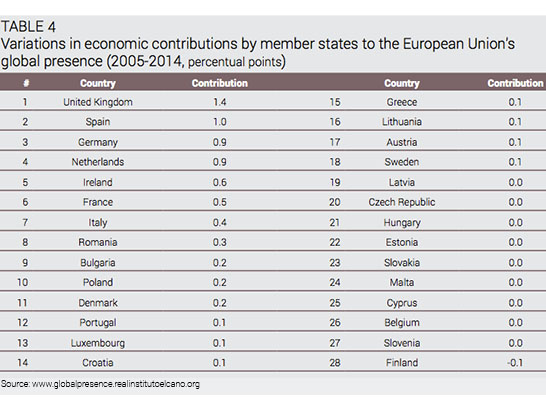
However, the evolution of economic contributions to global presence has been different from that of global contributions. First, most countries have increased their economic contribution to global presence –meaning an increased importance of the economic dimension in the external projection of the European Union–. In fact, all member states but Finland have increased their contribution in the 2005-14 period (Table 4). Secondly, the most important variations are those of bigger –economically, demographically– member states. The United Kingdom, Spain, Germany, the Netherlands and Ireland top that ranking (Table 5).
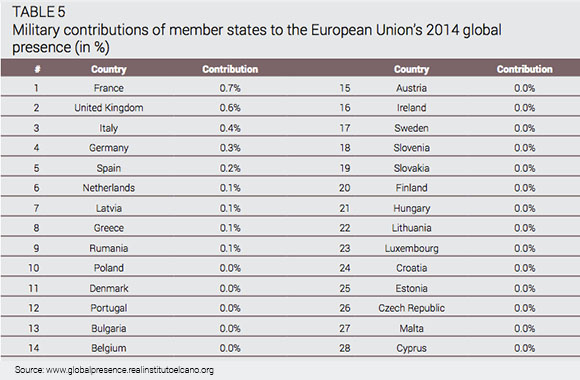
Military contributions reflect a similar picture. France (with a military contribution of 0.7% of the European Union’s global presence), the United Kingdom (0.6%), Italy (0.4%), Germany (0.3%) and Spain (0.2%) top the ranking. As usual, the military dimension shows a higher degree of concentration in a few member states. France, the United Kingdom and Italy account for 1.7% of the aggregated 2.7% military contribution by all 28 member states to the European Union’s total external projection (Table 5).
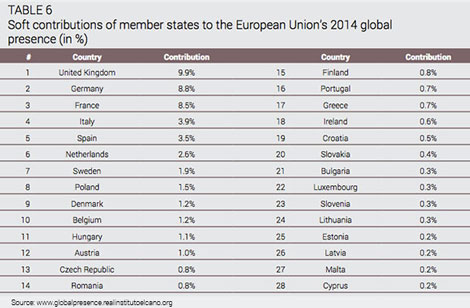
Again, the soft dimension ranking shows a strong parallelism with both global and economic contributions to the European Union’s global presence. The top four countries are the same. The United Kingdom’s soft dimension accounts for 9.9% of total European Union’s external projection. Germany is in second place (8.8%), followed by France (8.5%) and Italy (3.9%). Spain is fifth. It should be noted that Spain is the eighth global contributor to the European Union’s global presence index (Table 1), reflecting the country’s soft profile –a feature that has been highlighted in previous reports (Olivié et al., 2013 and 2014)–. Again, the top three countries account for over half the contributions of all member states (Table 6).

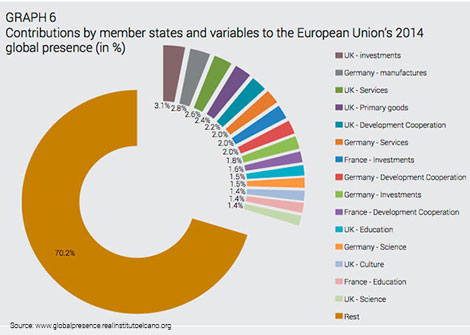
As a result, 49.7% of the European Union’s global presence can be ascribed to British, German and French economic and soft projection outside Europe’s borders. Therefore, these three countries are key to the European Union’s role as a global actor. The importance of these three countries is also evident in Graph 6, which plots major contributions to the European Union’s global presence by variables and by country.
Europe by regions: the contribution of autonomous communities to Spain’s global presence
For countries with regionally disaggregated statistical information –such as Germany, the United States, the United Kingdom and Spain– it is possible to calculate the contribution of sub-national regions (autonomous communities in the case of Spain) to the aggregate global presence of the country in question.
As shown in previous analyses (Olivié & Gracia, 2014),3 since 1990 Spain’s global presence has recorded a rapid increase in relative terms, well above that of other countries such as the United States and Portugal. However, a detailed analysis shows weaknesses and disequilibria in the features of this projection –concentration in tourism and sports, and lower contributions in technology and education to the aggregated presence–. In analysing Spain’s global presence with a geographical approach it is possible to create a regional profile of these strengths and weaknesses.
The autonomous community that contributes most to Spain’s global presence is Catalonia, with a share of almost 22%. It is followed by Madrid, Andalusia, Valencia and the Basque country. These five communities account for almost 70% of Spain’s total presence. At the other extreme, the five communities that contribute the least are the non-contiguous cities of Melilla and Ceuta as well as La Rioja, Extremadura and Navarre (Table 8).
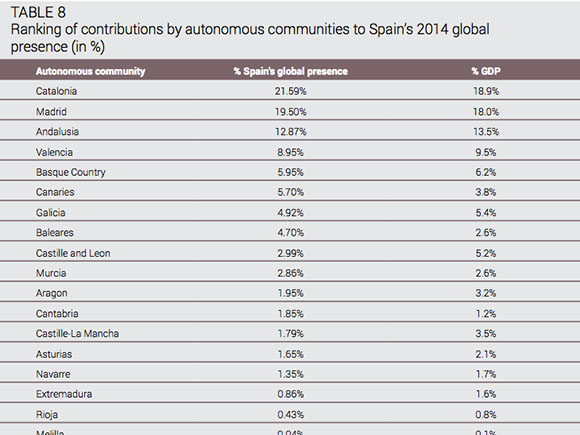
As with the global presence of countries, there seems to be a strong correlation between the size of a territory (autonomous community, country or group of countries) in geographic, demographic and/or economic terms and its capacity to project itself outside its borders. In general terms, the contribution of each autonomous community to Spain’s global presence is aligned with its contribution to total GDP (Table 8).
However, some communities are more outward-oriented, as their contribution to national global presence is higher than their share of national GDP. This is the case for Catalonia, Madrid, the Basque country, the Canary Islands, the Balearic Islands, Murcia and Cantabria. In some cases, like the Basque country, the share of global presence is only slightly higher than its share of GDP. In others, the participation in the country’s global presence almost doubles its contribution to the size of the economy. This is the case for the Canaries and Balearics –two important destinations for international tourism–.
Moreover, there is a strong concentration of Spain’s global presence in just two autonomous communities, Catalonia and Madrid. These two account for over 41% of Spain’s global presence –slightly above their participation in national GDP, which amounts to just under 38%–.
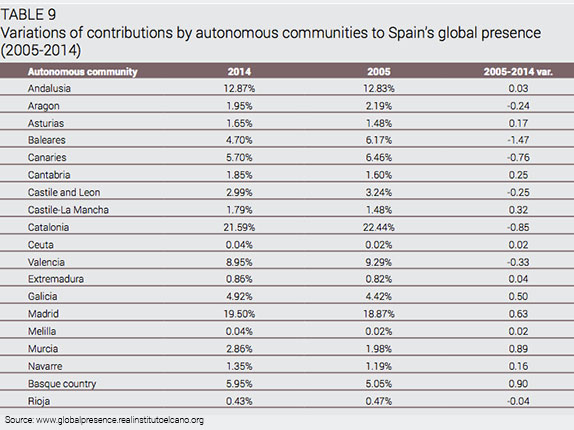
As pointed out in previous studies, the global presence index aims to reflect structural trends. In this respect, short-term elements scarcely have an impact on global presence values. This is probably why there have been no significant variations in the contributions of each autonomous community to Spain’s global presence over the 2005-13 period (Table 9). Catalonia records a small decrease (of 0.85 points) in its contribution, and Madrid a mild increase (0.63 points). Some communities have recorded more significant variations, like the Balearics (whose contribution decreases by 1.22 points) and Murcia and the Basque country (recording an opposite trend, up by 1.03 and 1.19 points, respectively).
The strengths of Spanish global presence are the country’s exports of primary goods and its capacity to attract international tourists. This being the case, we should expect that the autonomous communities that contribute most to the country’s external projection are agricultural producers and tourist destinations. Apart from very important contributions by Catalonia and Madrid, other poles of international tourism such as Andalusia and the Balearic and Canary Islands show a significant participation in the country’s global presence. Similarly, Murcia contributes a higher proportion to global presence than to Spain’s GDP as a result of its significant production and export of primary goods (Table 8).
The distribution of Spain’s global presence in terms of both variables and autonomous communities is evidence of the low added-value of the country’s external projection. Outward direct investment channelled through Madrid explains just over 5% of aggregated presence, and the fact that the capital is located there, along with a large share of corporate headquarters, helps to explain this phenomenon. As for Catalonia, its exports of manufactures account for 2.2% of Spain’s global presence. However, the bulk of major contributions by variable and community –those that represent at least 2% of aggregate global presence– are of lower added value. Tourism to Catalonia, the Balearics, the Canaries and Andalusia account for 14% of global presence. Exports of primary goods from Andalusia and Catalonia account for 4.6% of Spain’s external projection. As for exports of services (including different levels of technological complexity) from Madrid and Catalonia, these contribute 6.1% of Spain’s total global presence.
Conclusions
The European Union is the political unit with the most global presence, despite a decline over the past year. The decrease is mainly concentrated in its economic dimension, at a time of the euro’s depreciation against the dollar.
Although the nature of the European Union’s presence is fundamentally soft, the increase in presence have been due to its economic dimension.
To determine the local-global nexus, the Union’s sectoral and geographical presence data have been broken down. The results reveal a presence supported mainly by the economic and soft dimensions of the UK, Germany and France, which also top the main individual contributions by variable. In Spain’s case, a breakdown by regions shows high contributions of Catalonia, Madrid and, to a lesser extent, Andalusia and Valencia. However, by variables, the features to highlight are the contribution of tourism presence in the Balearic and Canary Islands and the relative importance of primary exports.
external page1Iliana Olivié, Manuel Gracia & Carola García-Calvo (2014), external pageElcano Global Presence Report 2014, Elcano Royal Institute.
external page2It should be noted that the significant increases recorded by Romania, Bulgaria and Croatia are due to the fact that these countries were not part of the European Union in 2005. Therefore, starting from 0 in 2005 the increase equals the index value in 2014.
external page3Iliana Olivié & Manuel Gracia (2014), “ external pageLa inserción exterior de España requiere una redefinición estratégica”, Estrategia Exterior Española, nr 1/2014, February.