Oil and Gas by the Numbers
8 Oct 2012
Before we begin to tackle the issues described in this week’s Dossier Introduction, we need to present a ‘by the numbers’ portrait of the major energy reserves in the world today, the most important supply routes that support them, and how consumer nations are attempting to lower their vulnerability to these supply chains by diversifying their reliance on energy resources.
Current Energy Reserves
According to external pageOPEC estimates, the world’s proven oil reserves stand at a little less than 1,500 billion barrels – or, at current consumption rates, another 47 years’ worth of oil. As the following map demonstrates, more than half of these reserves are located in the Middle East. Latin America, largely due to Venezuela, then accounts for another 23% of global reserves. (As a prominent example of an oil-based economy, it is worth noting that Venezuela’s oil sector accounts for external pageup to 95% of the country’s export earnings and 40% of the government’s budget revenues. This type of dependency can both be an advantage and a curse for ‘Dutch Disease’ nations, as is well documented.)
[Resource Embedded:153464]
World proven crude oil reserves by country (in million barrels). Source: OPEC
The distribution of known natural gas reserves, interestingly enough, stands in sharp contrast to global oil supplies. While the Middle East also remains a major supplier of natural gas, Russia – home to almost a quarter of proven gas reserves – is an equally important player. Its rise to prominence has coincided with a general external pageincrease in the trade and geopolitical significance of natural gas in recent years, largely as a result of falling transportation costs. In any case, proven gas reserves external pageare estimated at around 190 trillion cubic meters, or roughly 60 times the current rate of annual global gas production. In addition, recoverable conventional gas resources stand at an estimated volume of 400 trillion cubic meters.
[Resource Embedded:153465]
World proven natural gas reserves by country (billion standard cu m). Source: OPEC
World Oil Transit Chokepoints
The above numbers may be impressive, but the global energy market remains dependent, as it always has, on safe and reliable modes of transportation. In the case of oil, over half of the 87 million barrels per day (bbl/d) produced in 2011 were distributed by tankers using fixed maritime routes. More often than not, these vessels travelled through a number of regional chokepoints that are deemed critical to global energy security. The following map illustrates that while oil transit chokepoints are geographically dispersed, the majority of them are concentrated around the Middle East and Indian Ocean.

The next chart only reinforces the importance of these chokepoints for the transit of global oil supplies. The large volume of oil transported through the Strait of Hormuz into the Indian Ocean and beyond, for example, amply demonstrates that the Persian Gulf region is of critical importance to the global energy industry.
Volume of Crude Oil and Petroleum Products Transported Through World Chokepoints, by million barrels per day, 2007-2011
Location
2007
2008
2009
2010
2011
Bab el_Mandab
4.6
4.5
2.9
2.7
3.4
Turkish Straits
2.7
2.7
2.8
2.9
N/A
Danish Straits
3.2
2.8
3.0
3.0
N/A
Strait of Hormuz
16.7
17.5
15.7
15.9
17.0
Panama Canal
0.7
0.7
0.8
0.7
0.8
Crude Oil
0.1
0.2
0.2
0.1
0.1
Petroleum Products
0.6
0.6
0.6
0.6
0.6
Suez Canal and SUMED Pipeline
4.7
4.6
3.0
3.1
3.8
Suez Crude Oil
1.3
1.2
0.6
0.7
0.8
Suez Petroleum Products
1.1
1.3
1.3
1.3
1.4
SUMED Crude Oil
2.4
2.1
1.2
1.1
1.7
Source: external pageUS Energy Information Administration (EIA) (August 2012).
Any disruption to the shipment of oil through any of these chokepoints, as has been widely known for a long time, will have a profound impact upon global energy supplies and markets. The price of oil will have to increase to cover the costs of transporting resources via alternative (and sometimes impractical) routes, and the routes themselves would leave maritime tankers vulnerable to piracy, terrorist attacks and possible political unrest.
Unconventional Resources
Now what the above maps and charts plainly illustrate, at least from the viewpoint of the European Union, the United States and numerous other nations, is that a significant proportion of the world’s energy reserves and supply routes continue to exist in geopolitically sensitive locations. As a result, a host of states are continuing to look into energy diversification as a way to reduce their reliance on these regions.
In this respect, the exploration and development of unconventional energy resources may have a profound external pagetransformational impact on energy markets, not least because the geographic dispersion of these resources is closer to the largest consumer markets. However, in contrast to conventional oil and gas, unconventional sources tend to be external pagetrapped underground by impermeable rocks, such as coal, sandstone and shale. That means they need advanced technologies and copious amounts of water if the desired extraction is to occur. It also means that from extraction to final use, more energy is required to produce unconventional resources than normal ones.
Given these truths, should nations pursue unconventional energy sources (in the United States, shale gas production already accounts for over 30% of the country’s natural gas supplies), or should they heed the warnings of environmentalists, who claim that the idea of abundant unconventional resources takes pressure away from developing other alternative sources of energy? To help begin answering this question, we provide the following video from the Center for Strategic and International Studies (CSIS), where senior government officials and private sector representatives discuss recent shifts in the energy landscape as well as the economic, geopolitical and environmental implications of these shifts for the United States in particular.
[Resource Embedded:153466]
Oil prices
Finally, regardless of whether you believe in the virtues of unconventional or alternative sources of energy, or both, there is no question that technological innovation and the market for different energy resources have been spurred on by higher oil prices. This is well illustrated by our final graph, which charts the fluctuations in oil prices over the past 100 years. In particular, it shows that the pursuit of energy security gathered increasing momentum in 1973, when oil prices rocketed after external pageOPEC countries placed an oil embargo on the United States in response to its decision to re-supply Israel’s armed forces during the Yom Kippur War. external pageOther political events that have impacted on global oil prices include the Iranian revolution, Iraq’s invasion of Kuwait and, most recently, the political turmoil throughout the Arab world.
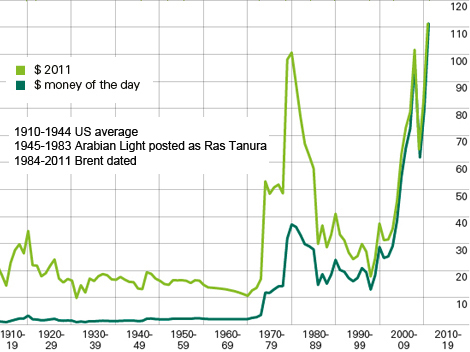
Indeed, what the chart ultimately underscores is a message that will apply throughout this week – i.e., global energy supplies will remain an integral feature of geopolitics and global security dynamics for the foreseeable future because some of the world’s leading energy producers try to parlay their reserves into actual political clout.