Social Vulnerability in Affluent Contexts: An In-depth Analysis of Social Vulnerability in Zürich
20 Jun 2018
By Florian Roth, Tim Prior, Linda Maduz and Anna Wolf for Center for Security Studies (CSS)
This article was originally published by the Center for Security Studies (CSS) in June 2018.
Executive Summary
This report develops a comprehensive view of the specific social situation in Zürich, and of the potentially important dynamics that could have an influence on social vulnerability in the city.
Methodology
To better understand social vulnerability in Zürich, CSS’s research team conducted, in a first step, several written and face-to-face interviews with experts working with very different social groups in the city of Zürich on a day-to-day basis. The insights gained during the expert interviews were used, in a second step, for a refined quantitative analysis of social vulnerability in Zürich, and the economic, demographic and cultural factors that influence it. The basis for both the interviews and the quantitative analysis was a set of scenarios of natural and human-induced hazards that could affect the city of Zürich: Flooding, chemical accident, pandemic, heatwave, earthquake, and criminality. Of these possibilities, three hazards were ultimately chosen for detailed spatial analysis: chemical accidents, flooding, and heatwave.
Temporal Variability in Social Vulnerability
Although Zürich is an affluent city, there are parts of the population that would lack the resources to cope with and recover from a major disaster. In many cases, vulnerability to hazards is associated with the same characteristics that determine vulnerability in everyday life, such as income, ethnicity, or age. However, the analysis found little evidence for a direct link between socio-economic factors and social vulnerability. Much more important was the issue of social isolation, which was found to be a main direct driver of vulnerability. Social isolation is particularly widespread among certain parts of the population (e.g. elderly people living alone, so-called sans papiers), whose situations may be exacerbated by additional socio-economic factors.
In the context of disaster management, these factors are becoming increasingly relevant, as Zürich is being affected by several large-scale demographic trends that will influence vulnerability: migration and the changed cultural and ethnic composition of the city; uneven economic development across the city; and, the aging population.
Spatial Variability in Social Vulnerability
The results of the spatial analysis show that some of the indicators of the social vulnerability identified from the expert interviews are geographically concentrated in areas exposed to different hazards.
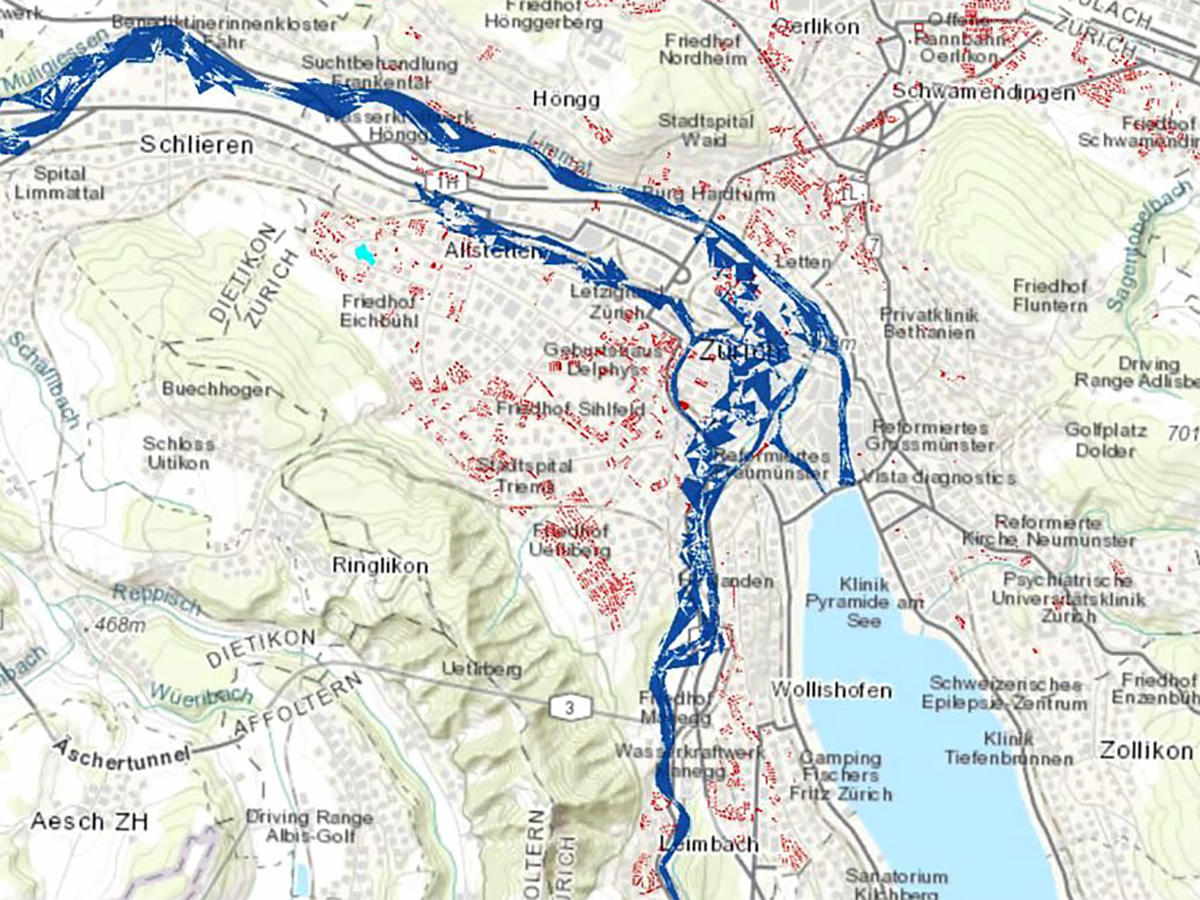
As Zürich is located at the confluence of two large rivers, floods are one of the most significant hazard for the city. Interviews highlighted that economically weaker people could be particularly susceptible in the event of a major flood. The spatial analysis demonstrated that several neighbourhoods with many charitable housing facilities (a proxy for economic disadvantage) are located close to potential flood risk areas.
While Zürich is not known as a centre of chemical industry, there are nevertheless several locations where a chemical accident could have serious consequences for nearby communities. Immigrants with limited knowledge of the official languages and poorly integrated minorities could be hard to alert in the event of a disaster. The spatial overlay of community spaces with chemical transport routes and sites can be used as the basis for developing a targeted risk communication strategy.
Finally, partly driven by climate change, heat waves are becoming an increasing problem for Swiss cities. Most vulnerable are elderly people with few social contacts. The analysis shows higher densities of elderly people in the central part of the city (where the urban heat island effect is most pronounced) where exposure to heatwave risk is higher.
Importantly, the project also demonstrated that some important aspects of social vulnerability cannot be represented spatially. For example, neither authorities nor non-governmental organizations have detailed knowledge about the whereabouts of sans papiers in the city. This illustrates the limitations of a cartographic approach to social vulnerability.
Conclusions and Implications
A first key finding of this project has been the observation that, while internationally recognized metrics of vulnerability present a useful basis of study, locally specific characteristics are also important, and these can be more difficult to represent cartographically.
Second, the project demonstrated that while disasters incite extreme impacts, vulnerabilty is not always caused by unusual factors. In fact, those people who are considered vulnerable in their everyday lives are also likely to be the most vulnerable in the context of a disaster. In this sense, the results highlight that a detailed analysis of the specific capabilities and requirements of various social groups is required to gain a social context-specific picture of vulnerability.
Last, given society’s dynamism, disaster managers must also adopt adaptive and flexible approaches to understand how societal changes might influence social vulnerability. The results suggest that social vulnerability can most effectively be addressed by a network of various governmental and non-governmental actors. Above all, actors in the social welfare domain and disaster management must be better integrated.
1 Introduction
In modern disaster risk management research and practice, social aspects of vulnerability are mostly overlooked, even though social factors have an indisputable influence on the severity of a disaster (Quarantelli, 1992; Yoon, 2012). To contribute to a better understanding of social vulnerability, in 2016 the Center for Security Studies (CSS) at ETH Zürich started a new, multi-year project, commissioned by the Federal Office for Civil Protection (FOCP). The project analyzes different dimensions of social vulnerability to develop practical mapping tools with a focus on social vulnerabilities in Swiss cities.
The first part of the project (see Prior et al. 2017) focused on the interdependence of various demographic, economic and cultural factors that influence social vulnerability in the context of flood hazards in the city of Zürich. It took a primarily quantitative approach to integrate data from different official sources to show how publicly available information can be used to identify and map areas of concern in disaster preparedness and management. The results of this first pilot study show that also in affluent communities like Zürich, there exist social groups which lack the capabilities to prepare for and/or respond to a major disaster and that these groups are often concentrated in certain geographical areas. Based on these findings, we were able to propose first measures to better consider vulnerable social groups in Swiss disaster management practices.
1.1 Aims and Scope of Report
The present study builds on our previous exploratory work on the topic, but aims to get a more comprehensive view on phenomena of social vulnerability than was possible beforehand. Again, it uses the city of Zürich as an interesting case to study how vulnerabilities manifest in overall affluent communities under changing demographic, economic and cultural conditions. Specifically, it broadens the perspective from the single issue of flooding in Zürich to an array of different natural, technical and social hazards. Overall, the study analyzes six hazards relevant to the city, which all were identified in collaboration with local and national disaster management experts: Besides floods, considered were: heat wave, chemical accident, crime, pandemic, and landslide (see section 3.2.1).
However, this study not only represents a topical extension, but also a qualitative revision and consolidation of its forerunner. To better understand the specific social situation in the city as well as potentially important dynamics that could have an influence on social vulnerability, CSS’s research team conducted several written and face-to-face interviews with experts working with very different social groups in the city of Zürich on a day-to-day basis (see sections 3.1 and 4). The insights gained during the expert interviews allow for a refined quantitative analysis of social vulnerability in Zürich, and the economic, demographic and cultural factors that influence it. Using additional open and restricted data sources, we are able to get a more comprehensive and more context-sensitive picture of the geographical (and non-geographical) aspects of social vulnerability to disasters in affluent communities.
1.2 Structure of the Document
The report is divided in six main sections. It is structured as follows:
After this introduction, we provide a brief overview of recent developments in social vulnerability research, focusing on vulnerable groups in affluent societies. Further, some of the key findings from the first part of the project are summarized, which serves as the basis for the present report. Moreover, we detail why it is essential to understand the local conditions in which social vulnerability manifests and how such context factors can be integrated in disaster management research and practice (section 2).
The next section describes the different elements of the study’s research design. First, the qualitative interview and survey elements are sketched out and the chosen hazard scenarios are detailed. Second, the data sources and the analytical procedure of the quantitative part including the mapping are introduced (section 3).
After describing the methodology, the first result section presents the main findings of the qualitative analysis. It starts off with the differences and communalities between social vulnerability in the context of disasters and everyday vulnerabilities. Further, main demographic, economic and cultural dynamics that are found to influence social vulnerability in Zürich are presented. Specific focus is put on the issue of social isolation and the spatial aspects of social vulnerability (section 4).
Following the qualitative analysis, the second result section aims to quantify potentially important social components in three hazard scenarios for the city of Zürich: Chemical accidents near social gathering points, charitable housings at the risks of river floods, and finally elderly people exposed to extreme heat waves. For all three scenarios, distribution maps are created that allow to better understand the geographical distribution (respectively concentration) of vulnerable social groups in Zürich (section 5).
The last section of the study summarizes the main findings from the qualitative and quantitative analysis and synthesizes them to draw conclusions of practical relevance to disaster managers, but also to spatial planners, social welfare institutions and other stakeholders (section 6).
2 Background
2.1 Affluent Societies and Vulnerability
The social characteristics of communities are extremely important for hazard managers because they increase peoples’ vulnerability to hazards. Understandably, socially disadvantaged communities exposed to hazards have to date received the most attention from disaster risk reduction (DRR) specialists. This is because hazards tend to harm predominantly those social groups that were already disadvantaged before a disaster. Large focus has been placed on “underdeveloped” or “developing” nations, where the social disadvantage factors are particularly obvious. For example, while studying the social aspects of food insecurity during droughts in the Sahel region in the mid-1980s, scientists showed that low-wealth families with many children were particularly susceptible to chronic food insecurity (Reardon and Matlon, 1985).
Recent research highlights that social vulnerability is a characteristic shared not just by under-developed and developing countries, but also by highly developed societies, where pockets of disadvantaged groups susceptible to hazards live alongside less vulnerable groups (Wisner, 1998; Cutter, Boruff and Shirley, 2003; Haque and Etkin, 2007). The assumption that all members of affluent societies are somehow immune to disasters seems to be broadly shared, perhaps because vulnerability may be less obvious. This (mis)belief seems to be reinforced by various attempts to index and compare the vulnerability of communities, regions or whole nations (see, for example ATSDR, 2017). In fact, making inferences about disaster vulnerability based on aggregated economic characteristics often leads to misleading conclusions. This problem is known as the ‘ecological fallacy’, where relationships on the aggregate level do not necessarily hold on the individual level (Freedman, 1999). For instance, research from the 1990s demonstrated that homeless people in Tokyo (at the time one of the wealthiest cities in the world) were far more vulnerable to earthquake hazards than the average resident (Wisner, 1998). Problematically, emergency planning by government overlooked this “invisible” sub-population. In this case, the “ecological fallacy” meant there was a tendency for emergency planning activities to be directed toward a higher socio-economic class. Additionally, research conducted in the wake of Hurricane Katrina’s impact on New Orleans in 2005 has shown that socio-economically disadvantaged households and communities were disproportionally affected by the hurricane. These people lacked the capabilities to prepare for, respond to and recover from the event (Cutter and Emrich, 2006).
These examples, from affluent and less affluent countries, suggest the need to consider social vulnerability in more geographically and demographically nuanced ways when implementing DRR activities. On the one hand, poorer communities might bring alternative capabilities to DRR that are non-financial (UNISDR (The United Nations International Strategy for Disaster Reduction), 2015). On the other hand, ignoring existing social disadvantage within affluent contexts risks significant loss of life and property, and forgoes the opportunity to improve the circumstances of the affected sub-population. Moreover, economic, demographic or cultural dynamics may create new challenges and vulnerabilities that the established systems of developed countries may not be prepared for. For instance, how does refugee migration deepen, moderate, or otherwise change social vulnerability within communities (Geenen, 2010; Pauver, Twigg and Sagramola, 2016)?
Even though groups of people living in places where the overall socio-economic status is higher can also be vulnerable to hazards, knowledge about people and society’s vulnerability to hazards in these countries remains patchy (Fekete and Hufschmidt, 2016). To address this research gap, the present study aims to contribute to our understanding of the emergence, composition and geographic location of vulnerable social groups in developed contexts.
2.2 Previous Work by CSS
The present study directly draws on several previous research projects, conducted over the last several years by the CSS that all examined the social dimension of disaster risk.
The institute’s first studies on social vulnerability in Switzerland were conducted in 2010 and focused on the 2005 flood events in several parts of the country (Bara, 2010a, 2010b). These studies found that while Switzerland is among the most highly developed countries in the world, social vulnerability nevertheless exists. The existence of pockets of social vulnerability translate to a heightened risk of disaster for those groups, and inhibits recovery.
Drawing on these first analyses, in 2016, the research team developed a social vulnerability mapping concept focused on flood risks in the City of Zürich (Prior et al. 2017). This new study established a fast and easy means to understand and map factors that influence social vulnerability within the population, which in turn affect people’s capacity and willingness to respond to and recover from hazards. Social vulnerability was understood as an interdependent social feature, and the Team has established composite social vulnerability indicators as proxies for important aspects of the Swiss Integrated Risk Management Cycle, including: risk awareness, evacuation, and coping capacity. As part of the project, several interactive maps of the City of Zürich were produced to depict different dimensions of social vulnerability to flooding risks. This information is of central importance in the context of risk mapping to identify priority areas for hazard management attention. The 2016 project has received significant support from current partners at the City and Cantonal levels
2.3 Importance of Context-Sensitivity
The 2017 follow-up study seeks to build on the findings from the 2016 pilot study in two ways: by gaining a better understanding of social vulnerability in the context of different hazards, and by developing more context-sensitive social vulnerability indicators. Zürich remains the focus of work, but vulnerability mapping is extended beyond flooding hazards, to match the broader risk profile of the city. Our previous work has highlighted the need for indicators of social vulnerability to be accurate and hazard specific. For example, one social group might be heavily affected in the case of a major flooding event, but the same group may be able to cope rather easily with a serious power blackout. Therefore, it is necessary to develop “a balanced approach” (Birkmann et al., 2013, p. 32) that captures both hazard independent vulnerabilities and hazard-specific vulnerability characteristics.
Further, the study aims to improve the original vulnerability indicators through a deliberative process that strongly draws on the expertise of local actors. Today, most research on the topic is only able to provide a generic picture of vulnerability from ex post analyses of disaster events. Accordingly, as already discussed in section 2.1, vulnerability is described by characteristics such as income inequality, age, education, gender, language, ethnicity and community cohesion (Birkmann 2013). These characteristics, typically elucidated from census data, provide a generic, but imperfect picture of social vulnerability, because the dissociated manner in which the characteristics are utilized fails to capture the complexity and context-specificity that defines social vulnerability in real households and communities. Also CSS’s original social vulnerability indicators used in 2016 were mainly based on international research.
Departing from this, our work conducted in 2017 aims to develop new social vulnerability indicators reflecting more specifically the local risk context of social groups in Zürich. This connects to recent research that highlights that social vulnerability must be described by the associations between characteristics in order to capture the complex and non-linear interplay of individual and social factors, which vary markedly between local contexts (Rufat, 2013).
Problematically, social vulnerability in society is still conflated with economic weakness (Eriksen and Simon, 2017). To obtain a more realistic picture of the complex interactive processes that cause social vulnerability in different contexts, the conceptual context-specific framework in this project will be built from a localized-approach, hinging on a participatory process involving local experts and stakeholders to identify vulnerability factors and their interdependencies.
This way, the study aims to capture key context developments, such demographic change or the influx of immigrants that characterize life in the city of Zürich and create new challenges for social organizations and disaster managers alike. For instance, Zürich’s ethnic mix-up has changed significantly over the last decades. From a reasonably homogeneous society in the 50s-70s, to one with increasingly diverse population – how are authorities and processes structured to deal with these temporal population characteristic changes that impact on the way effective civil protection is delivered. Through this localized approach to social vulnerability, the project contributes to a more context-sensitive understanding of societal resilience, providing the basis for more tailored and effective risk management strategies for the city of Zürich.
3 Methodology
The present study combines a mix of different empirical research methods that verify and extend the findings of work conducted on the social dimension of disaster risks in Zürich in 2016 (Prior et al., 2017). The combination of quantitative and qualitative approaches provides a comprehensive picture of social vulnerability in the affluent context of Zürich.
Using a quantitative approach, the authors have been able to make use of the fast-growing quantity of data, derived from various sources, which relate to social vulnerability, many of which contain geographical information that allow the social vulnerability data to be associated with particular geographical areas of concern. However, a purely quantitative analysis may not explicitly consider the specific local contexts that can have a major influence on social vulnerability ( Cutter & Finch 2008). In addition, a narrow focus on characteristics that can be measured quantitatively (age, income, etc.) would ignore those aspects of social vulnerability that are harder to measure and where few data (if any) is available.
To overcome these issues, the authors first conducted a qualitative analysis of social vulnerability in Zürich to get an in-depth understanding of the complex factors that influence the vulnerability of social groups in the city. Using expert interviews and a written survey, the authors explored the conditions and characteristics that make parts of the city’s population particularly susceptible to a number of natural, industrial and social hazards. Taking into account the specific social, cultural and political contexts of the city of Zürich, this element of the analysis drew on the local knowledge of experts working on different aspects of the city’s social life. This qualitative approach also captured those issues of vulnerability that are hard to measure and therefore have often been overlooked in existing social vulnerability research, including previous work conducted by the authors (Prior et al., 2017).
Building on these findings, the second element of the approach examined the extent to which quantitative indicators can be used to uncover the geographical distribution of social vulnerabilities in urban areas. Specifically, we detail three case studies that demonstrate how social vulnerability can be detected by mapping individual and community level characteristics against hazard information (chemical risk, flooding, and heatwaves). Additionally, we discuss the difficulty associated with mapping social vulnerability against a diffuse social hazard (pandemic risk).
3.1 Qualitative Assessment of Social Vulnerability in the City of Zürich
Many social vulnerability studies explore the topic using very similar conceptions. The work has explicitly or implicitly followed the assumption that social vulnerability is a rather stable concept that can be measured (and mapped) in different places based on a set of similar socio-economic indicators, such as age, income and gender. Departing from this view, the present analysis sought to examine social vulnerability as a strongly context-dependent concept. Consequently, in order to deepen our understanding of how different subgroups of Zürich’s population might be affected by different hazards, we conducted expert interviews with local professionals working in the field of social assistance and emergency management in Zürich. These interviews sought to establish a locally specific idea of those groups of the population considered to be socially vulnerable based on local knowledge from experts working in the city. Interview data was supplemented with results from a survey conducted with additional experts and stakeholders who could not participate in an expert interview.
3.1.1 Choice of Hazard Scenarios
The basis for both the interviews and the survey was a set of scenarios of natural and human-induced hazards that could affect the city of Zürich. The selection of the scenarios aimed to cover a rather broad range of different hazards in which social aspects could play a significant role (see Appendix 1). The choice of the scenarios was made by the research team in close consultation with representatives from the city’s police department and the Federal Office for Civil Protection (FOCP). Both organisations take lead roles in disaster risk management at the national and the local level, respectively. Ultimately, six scenarios were selected:
- Flood: A 300-year flooding event sets parts of Zürich under water for up to ten days. Reconstruction of infrastructure takes up to two months.
- Earthquake: A level-IX earthquake damages buildings and infrastructure in a radius of 80 kilometres around the epicentre near Zürich. Search and rescue operations last about four days, recovery to a certain degree of normalcy takes about six months.
- Heatwave: Following a 2-3 month hot phase during summer, a 2-week heatwave strikes across Switzerland. Larger cities are particularly affected. Day temperatures rise beyond 35°C, night temperatures do not fall below 20°C, also the ozone concentration stays very high during the whole period.
- Chemical accident: A fire in a chemical industry complex close to the city of Zürich leads to the release of toxic fumes. Water used while extinguishing the fire pollutes nearby waterbodies. Although the fire and toxic emissions are controlled within 12 hours, the environmental impacts last a further six months.
- Epidemic/pandemic: 25 percent of the Swiss population are infected by a new type of easily transmittable influenza. Two percent have to be hospitalized, death rate of those infected is 0.4 percent. After six weeks, the rate of new infections starts to decrease, after 12 weeks only few new infections are reported. It takes 4-6 months to develop a functional vaccine and another four weeks to make it accessible to the whole Swiss population.
- Crime: Over a period of several weeks, an exceptional spate of burglaries affects different parts of Zürich. The incursions happen during both day and night, irrespective of whether residents are at home.
Following the general scope of the study, the focus of the interviews and surveys were deliberately placed on extreme scenarios that would have serious negative effects on the objective and/or subjective safety of a significant share of the city population. In addition, the scenarios were chosen because they pose serious challenges for the actors involved (in terms of preparation, response and recovery), and that each scenario is possible at any time.
3.1.2 Expert Interviews
The scenarios were used in the interviews with experts who, based on their daily work in Zürich, could provide relevant information on potentially vulnerable groups within the city’s population. The central selection criteria was that due to their day-to-day interaction with the members of the local communities, the experts have an overview of which elements of society would be particularly susceptible in the event that the major disaster scenarios presented came to pass. Moreover, it appeared important to complement the views of representatives of the authorities with those of non-government organizations.
Overall, four expert interviews were conducted with representatives of organisations identified in collaboration with the FOCP (in total five institutions were identified). Interviews were conducted with the social welfare department of the Canton; with the disaster management branch of the City’s Police Department; with the Swiss Red Cross, and lastly, with Surprise, a NGO working with unemployed and homeless people (see section 3.1.3). All interviews were conducted between June and July 2017.
At the beginning of the interviews, the hazard scenarios (see Appendix 1) were given to the interview partners and described by the interviewers. This preceded the actual interview, which was lead using a semi-structured interview schedule (Appendix 2) covering a broad range of aspects concerning social vulnerability and resilience. Interview questions focused on the most critical issues associated with urban disaster management, including:
- alerting, evacuation and recovery,
- the characteristics of those elements of society lacking the capabilities to cope with these specific tasks associated with disasters,
- with respect to important changes in the city’s population that could have an effect on its vulnerability,
- which districts or areas would be particularly vulnerable in the face of a disaster,
- how issues of vulnerability were considered in the work of the relevant organizations today.
Each interview was conducted by at least two researchers and lasted between one and two hours. All interviews were audio-recorded (with permission given by the interviewee), transcribed and systematically analysed using the software package MAXQDA (version 12), which supports a structured and transparent data analysis process. The anonymity of all interviewees was maintained.
3.1.3 Stakeholder Survey
Additional perspectives from relevant stakeholders were collected using a written survey. This supplementary approach allowed the project team to gain a more comprehensive picture of social vulnerability in the city. The survey was conducted between June and August 2017. The target population for the survey was identified in collaboration with the city police and the FOCP. Fifteen organizations were contacted and eight participated in the survey Organisations included: the Behindertenkonferenz Kanton Zürich (BKZ), an organization representing the interests of people with disabilities; the Gebäudeversicherung Kanton Zürich (GVZ), a building insurance association; the prevention and analysis branch of the city police; the city’s security department; the Asyl-Organisation für den Kanton Zürich (AOZ), a public service for immigrants; the Vereinigung der Islamischen Organisationen in Zürich (VIOZ), a Muslim organization; the Krisenintervention Psychiatrische Universitätsklinik Zürich (KIZ), a psychiatric crisis intervention center and the Sans-Papiers Anlaufstelle Zürich, an NGO working with illegal immigrants.
The survey contained 14 open and eight closed questions, similar to the opening questions of the interviews (see appendix 3). The responses from the survey were also coded and analysed in MAXQDA, where they could be merged with the results of the expert interviews. The anonymity of all survey participants was maintained.
3.2 Quantitative Spatial Analysis
The second element of the empirical analysis aimed to map, against several of the chosen hazards, features of the population considered to be socially vulnerable.
As discussed above, in analysing social vulnerability to disasters, the authors recognize that mapping perceived vulnerabilities is sensible only in some instances. In other cases mapping may not be feasible for conceptual or practical reasons. This issue may be a result of the non-spatiality of some hazards (e.g. cyber risks), or the difficulty of identifying the spatial extent of vulnerable groups (e.g. people living in Zürich sans papiers). Additionally, as will be discussed in section 4.4, intangible factors influencing vulnerability, like psychological and cultural aspects including social isolation, depression or identity, are very difficult to represent spatially.
Nonetheless, we argue that mapping can be very useful when it is feasible. We illustrate this using three case studies examining different hazards and vulnerability factors for which a spatial analysis can yield interesting and useful results.
3.2.1 Choice of Case Studies
Cases for quantitative examination were again discussed with research partners from the City of Zürich Police Department, and the Federal Office for Civil Protection. Hazards under discussion included: Blackout, Flooding, chemical accident, strong rainfall, pandemic, heatwave, extreme snowfall, landslide, and criminality. The research team explored the ability to map these hazards, many of which have not been examined in a spatial manner. Flooding, chemical accidents, a heatwave, landslide, and pandemics have been mapped by the Canton of Zürich in ways that can be examined. Pandemic was excluded from the study as the spatial information was not available before publication,1 and landslides were not included because the risk areas mapped by the Canton did not significantly overlap with areas of large population.
As such, for the purpose of this study, the quantitative element of the project was limited to examining the relationship between three hazards (chemical risk, flooding and heatwaves) and the existence of potentially vulnerable members of the Zürich population.
The vulnerability characteristics chosen to be examined in connection to these hazards was based either on results of the qualitative analyses conducted in the current project, or on existing research. Qualitative results reported in section 4 highlighted the importance of community spaces as gathering points for some vulnerable groups of the Zürich population, including religious groups. The work also demonstrated pockets of vulnerability can often be concentrated in the same areas where charitable housing exists, where charitable housing becomes a proxy for lower socio-economic advantage. Existing research demonstrates that older members of the population are disproportionately affected by heatwaves than other members of the population points. As such, the quantitative analysis focusses on the following hazard-vulnerability couplings:
- Chemical risk relative to religious community spaces.
- Flooding risk to people living in social welfare housing.
- Heat wave risks to the older members of the population (older than 60 years).
The analytical results of these specific cases is detailed in section 5.
3.2.2 Data Sources
The analysis relied on two sources of data, both publically available for the most part. Mapped hazard data was provided by the Canton of Zürich’s Department for Water, Energy and Air for the chemical risks and flooding in the city (via TK Consult, who were contracted by the Canton to map flooding). The simulated heat wave map for Zürich was provided by colleagues from the Chair of Building Physics at the ETH Zürich and the Swiss Federal Institute for Materials Science and Technology (EMPA).
Social vulnerability data on the Zürich population was drawn directly from the City of Zürich’s Open Data Portal.
3.2.3 Data Analysis and Mapping
All mapping and cartographic analyses were conducted in ESRI ArcMap 10.5. All social vulnerability data from the City of Zürich were analysed using Microsoft Excel, and represented spatially using the ESRI ArcGIS for Office program extension. These data were also exported into ArcMap 10.5.
4 Temporal and Spatial Dynamics of Social Vulnerability in Zürich: Qualitative Findings
This section presents the results of the qualitative interviews and survey conducted with experts and stakeholders working in the city of Zürich. First, the differences and communalities between vulnerability in everyday life and in disaster situations are discussed (section 4.1). Thereafter, several social and demographic trends are presented that have implications for disaster management (section 4.2). Next, we focus on the issue of social isolation, which took a central role during many expert discussions (section 4.3). Finally, the possibilities and limits of mapping social vulnerability are discussed (section 4.4 ).
4.1 Comparing Vulnerability in Everyday Life and Disaster Vulnerability
As already elucidated in section 3, the study approaches the phenomenon of social vulnerability by using the knowledge of experts working with different social groups of the Zürich population on a day-to-day basis, not during major disasters (given the city has no recent experience of a disastrous event). Therefore, a first question to understand social vulnerability in the context of disaster risk management is: How far vulnerability towards potential extreme events differs from the challenges people have in their everyday lives? Would the social groups most affected by, for example, a large-scale earthquake or an extensive blackout be the same as the ones susceptible to more common, personal adversities, such as unemployment or illness?
In short, the answers from the expert interviews and survey is generally yes. Though exceptions to this rule exist. In the majority of cases, the experts surveyed assume that if one of the catastrophic scenarios described above occurs, it would primarily affect those sections of the population that are among the socially vulnerable groups in everyday life. This is also supported by the finding that levels of vulnerability among social groups tend to be unrelated to the potential impacts of a specific hazard. In other words, similar people would suffer the most from the consequences of an earthquake that would also be affected the most by a pandemic, for instance. The only exception in this respect was the crime scenario. Many experts did not perceive this issue as a disaster, and felt that criminality would affect a very different population segment than the other hazards examined.
Even so, equating vulnerability to disaster with everyday life vulnerability would be an oversimplification. In particular, preparing for or coping with a disaster requires specific knowledge and capabilities, and those people unable to deal with these issue may not be the same as those who are vulnerable in their daily lives. Indeed, social groups that might otherwise be considered highly vulnerable can actually be surprisingly resilient in the event of a disaster. Under certain circumstances, people who are otherwise considered “socially weak” might cope even better with a disaster than many other people. Examples given during the interviews include immigrants from areas where natural disasters are frequent. The interviewees suggested that refugees with previous hazard experience in their home country may have high adaptive capacities during a major disaster in Zürich. Also, some homeless people are reported to be less vulnerable than one might suspect: “They may be more alert. Many of them are survivalists. For 10, 20 years they are fighting for survival. They’re pretty tough” (Interviewee 9).
In turn, under extreme circumstances, even privileged groups can suddenly be at high risk, for example due to their individualistic lifestyle or the exposure of their homes to natural hazards.
4.2 Population Trends, Changing Vulnerabilities
Previous research shows that changes in the social, economic and demographic set-up of a community are often accompanied by shifting social vulnerabilities (Cutter & Finch 2008). Over the last decades, Zürich has undergone significant changes. To capture their potential consequences for disaster management, the experts were asked to reflect on key developments relevant in the context of disaster management. The results show three major trends that are of interest:
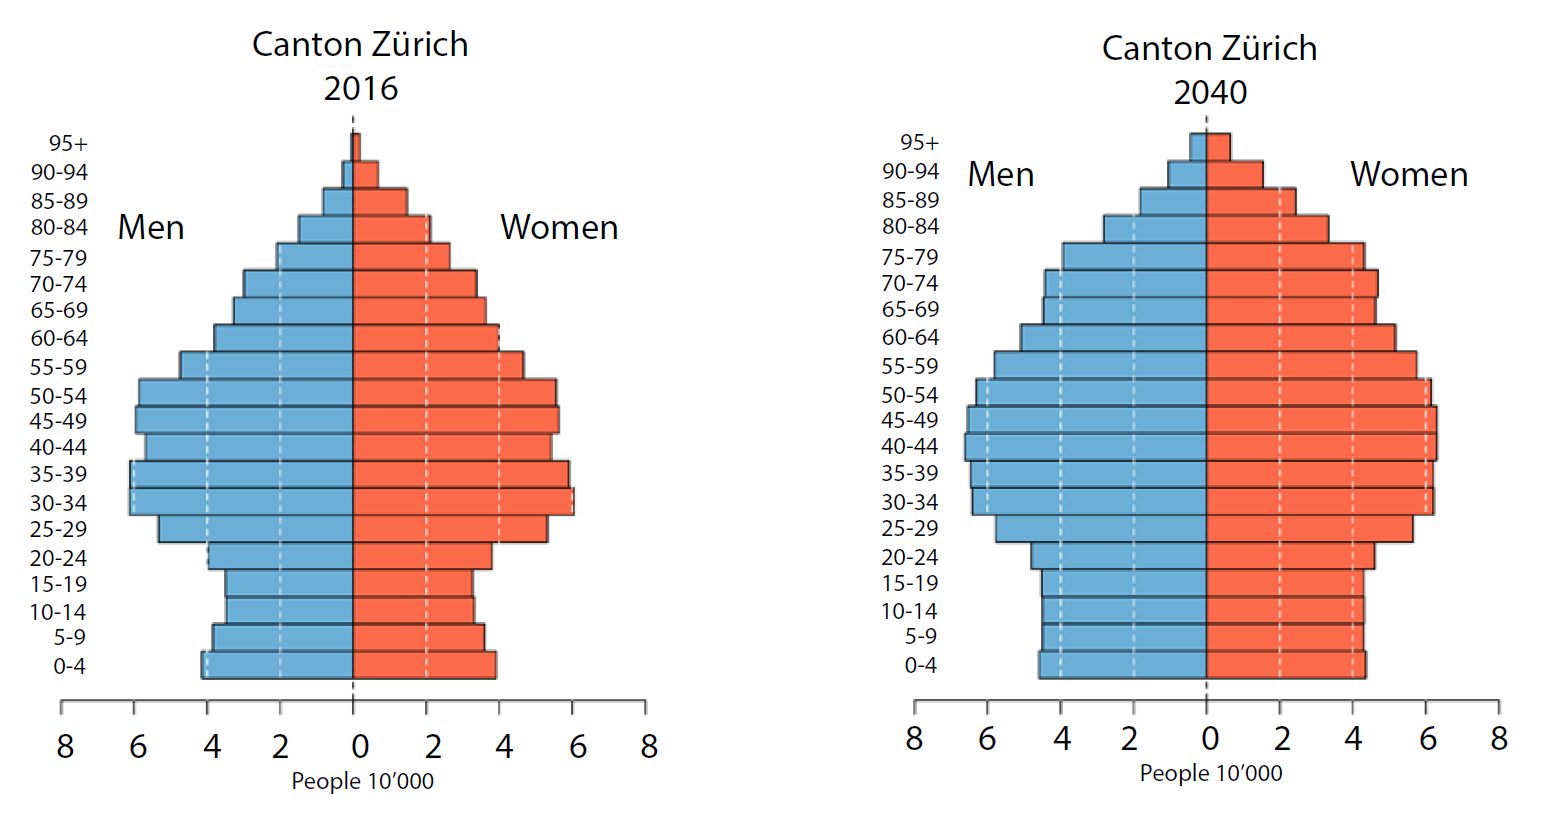
First, Zürich is becoming older (Bucher and Hofer, 2012). At the beginning of the city’s modern population statistics in 1888, only 8 percent of the population were 65 years or older. Since then, the share of old people has more than tripled – and will most likely continue to rise (see Figure 1). Even though today many people are still fit at a high age, the experts are worried by an increase in elderly people with physical and/or psychological limitations: “Old age is on the rise, often with multi-morbidity” (Interviewee 12). In the event of a disaster, people with hearing impairments require specific attention, as they are hard to reach through conventional alerting channels, such as sirens and radio. If an evacuation is necessary, people with physical limitations, for example people relying on wheelchairs or other walking aids, severely overweight people, or people with respiratory problems, would be of major concern requiring special assistance. In the recovery phase, elderly people may have a particularly hard time enforcing their insurance claims. According to one expert, the attitude of some insurance companies seems to be: “These are old ones, so now we try to pay as little as possible” (Interviewee 12). Another problem that is expected to aggravate in the future is the number of old people with weak social networks. One respondent remarked: “Since 3 to 4 years we see the phenomenon that they no longer have contact persons” (Interviewee 12). Particularly at risk of social isolation are old people with dementia.
Notably, elderly people who receive institutional support (for example via Spitex or the Swiss Red Cross) are generally considered to be less vulnerable, because the organizations that provide their care would also be expected to support them during an emergency. However, several interviewees noted that these organizations themselves could be affected by a crisis, thereby reducing the effectiveness of their performance: “There is a problem when an event occurs and the Spitex employees themselves are victims. Then the channel or the connection to these people [who are being cared for] breaks off. If nobody comes to them anymore, they are on their own” (Interviewee 11). As will be discussed in detail in section 6.3, the contingency planning for such scenarios (for example, failure of a large number of nurses during an epidemic, failure of EDP systems during a power outage) seems to be in its infancy.
Second, the city faces the risk of economic division. This is mainly due to rising living costs that particularly affect low-income groups. Not only in central parts of the city, but also in the wider Zürich conurbation, have rents increased dramatically. Between the years 2000 and 2016, rents have gone up by 20 percent. In comparison to 1982 rents have even doubled (Stadt Zürich, 2017b). Especially for new arrivals, it is extremely difficult to find affordable living space.
At the same time, in Zürich (as in the rest of Switzerland) incomes have become more unequal. After a period of converging incomes in Zürich from 1995 to 2003, indicators of income inequality have gone up again since then (Kanton Zürich, 2013). Consequently, the group of so-called “working poor” is growing, with single parents, large families, low-qualified workers, migrants, and singles being at the highest risk of poverty (Caritas, 2017).
According to the experts interviewed, poor people and people at high risk of poverty are susceptible to many hazards, for instance because they cannot effort preventive measures. As will be discussed in detail in section 4.4, economic polarization is especially worrisome if it is associated with geographical segregation that can increase the exposure of specific economic groups. Besides this, the recovery phase after an event is seen as a main challenge for economically weak people. The results suggest that many poor people would be unable to cope with the economic consequences: “All those affected by poverty would be affected by the material losses. They cannot just go to the store and buy new clothes, instead they need considerable support very quickly” (Interviewee 12).
Lastly, Zürich is the becoming increasingly diverse. Over the last fifty years, the share of foreigners among the city population has more than doubled from just 15 percent in 1966 to over 32 percent in 2016 (Stadt Zürich, 2017a). While most immigrants come from neighbouring countries, also the number of people with non-European origins has risen rapidly. Their composition is quite heterogeneous. Among them are working migrants, international students, expatriates, and asylum seekers. In addition, over 16 million tourists from all over the world visit the Zürich region every year (Zürich Tourismus, 2013).
Most interviewees and survey respondents emphasized that a migrant background alone does not make an individual vulnerable. Many migrants are active citizens, often well-connected in their neighbourhoods, as well as in religious and cultural groups. Problems arise mostly when the willingness or ability to integrate (especially language acquisition) and the “understanding of the Swiss system” (Interviewees 10 and 11) is missing. For instance, people who only use foreign media will not be reached through Swiss television and radio, which both play an important role in the national alerting system.
A special challenge associated with refugee migrants are traumas, common with individuals and families from crisis regions, and which may be recurring in the case of a catastrophe. As one expert explained: “Persons who are psychologically burdened because of events in the country of origin or their flight experience would have more trouble processing a new loss” (Interviewee 8). In addition, some refugees have distrusted local officials because of their previous experiences with state authorities in their home or transit countries. This could impact on their readiness to follow local authority advice in the case of an event in Switzerland.
Among migrants, the so-called Sans Papiers are considered particularly vulnerable because they are badly networked, as a distinct group, and with the broader population. It is interesting that, from the authorities’ point of view, it is easier to contact immigrants once school-age children have begun to attend local schools. This gives authorities better “access”, as one respondent described it.
4.3 The Key Role of Social Isolation
Across the hazards considered in the study, a central position in the assessment of most experts is the issue of social isolation. Isolation is considered to have a negative impact on almost all aspects of vulnerability, including being poorly informed or completely uninformed when a crisis is impending or strikes. The socially isolated are less likely to take appropriate steps in response to a disaster, struggling to cope with the material and immaterial effects of a disaster.
Sometimes social isolation is driven by external factors, such as job loss, divorce, migration, or state repression. But also internal factors play an important role, for example, illness, addiction, and anxiety. The interviewees also noted that mental illness has become a common factor driving social isolation in recent years. This could be caused, among other things, by professional pressure, personal strokes of fate, or experience of war and flight. This creates new vulnerabilities, for instance if people isolate themselves from their communities as well as from the media.
Although the experts found it hard to predict the psychological effects of disaster events on different social groups, there was consensus that in general, people who have psychological problems before an event often lack the resources to adapt and deal with extraordinary stress: “People who are very habitually attached to mental health problems are slow to accept change” (Interviewee 4).
Also, people with psychological problems tend to have a low self-efficacy, which is a fundamental prerequisite for taking protective measures in the event of a disaster. As one expert explained: “You have to see that when individuals are in the process of social isolation, they are increasingly focused on their own personal basic structures. In such a situation, you do not feel that affected by the things around you, you are against the others, maybe you don’t listen to them” (Interviewee 12). Even after a disaster, isolated people are considered particularly vulnerable, because their material and immaterial losses are not absorbed or mitigated by their social environment: “I feel that interpersonal networking is the most important thing, even in aftercare” (Interviewee 11). People that lack strong social networks are considered to be less adaptable to new situations and challenges that arise during or after disaster events.
These results suggest that “classic” individual indicators of social vulnerability, as found in most literature, such as age, gender, income, ethnicity, etc., have a rather mediated effect. By increasing the risk of social isolation, these factors can indirectly put people at the risk of disasters, even though there are few direct links with social vulnerability. For example, most people with physical disabilities are not considered vulnerable, because their special needs are met in the context of welfare state care (e.g., home care, Spitex, etc.). However, when physical disabilities combine with psychological problems, this often leads to social isolation, and a lack of assistance. In the event of a major disaster, a lack of support poses a high risk to people with physical disabilities.
The expert interviews revealed that those groups of people particularly vulnerable are those that are unable or unwilling to break out of their isolation, even under extreme circumstances: they are afraid of asking for help. These include in particular:
- Lonely elderly people (for example, with onset of dementia);
- Migrants without legal residence, so-called Sans Papiers (for example, migrant workers without a working permit, often from East and Southeast Europe, or Latin America, rejected asylum seekers);
- People with mental health problems (for example, anxiety, depression, schizophrenia, paranoia, addictive disorder).
These people often avoid contact with authorities, but also with health services and doctors. For instance, one expert described the attitude of many long-term unemployed people, often with drug addictions, towards medical assistance: “They are terrified of doctors. Very many of them. We had those who hid for years and did not want to see a doctor” (Interviewee 9).
The issue of social isolation highlights the importance of governmental actors in the context of social vulnerability. The results suggest that the groups at highest risk are those that refrain from seeking governmental assistance, primarily because they fear repression or generally lack trust in authorities. For example, in the case of an ordered evacuation, Sans Papiers may ignore public announcements and try to hide instead. On the other hand, in those cases where a certain trusted relationship has been established, the experts see fewer problems. For example, Switzerland’s progressive drug policy of recent decades is seen as a positive step that can prevent a “slipping” of addicted people beyond state structures, which is seen to be an important step and highly valuable in the context of disaster management. Similarly, the relationship between local authorities and homeless people has improved over the last years, reportedly also through moderation by non-governmental organizations. Another potentially vulnerable group oftentimes struggling with legal constraints are sex workers (oftentimes overlapping with the group of Sans Papiers). According to one expert, establishing a trusted relationship between authorities and this highly marginalized group can reduce the social isolation of this group. As will be discussed in section (section 6.1), stronger efforts should be undertaken to counter such fears and improve the relationship between marginalized social groups and state authorities.
4.4 The (Non-) Spatial Nature of Social Vulnerability
For disaster managers it is of key importance not only to know which population groups require special assistance for preparing and responding to hazards, but also to have a detailed picture of the geographical areas that their attention should be focused on. To this end, the experts were asked to name parts of Zürich were they saw particularly high (or low) levels of vulnerability. The results show that in parts, there is already a detailed knowledge about the geographical location of vulnerabilities. However, important aspects of social vulnerabilities remain hard to map, either because little data is available or because relevant factors are intangible.
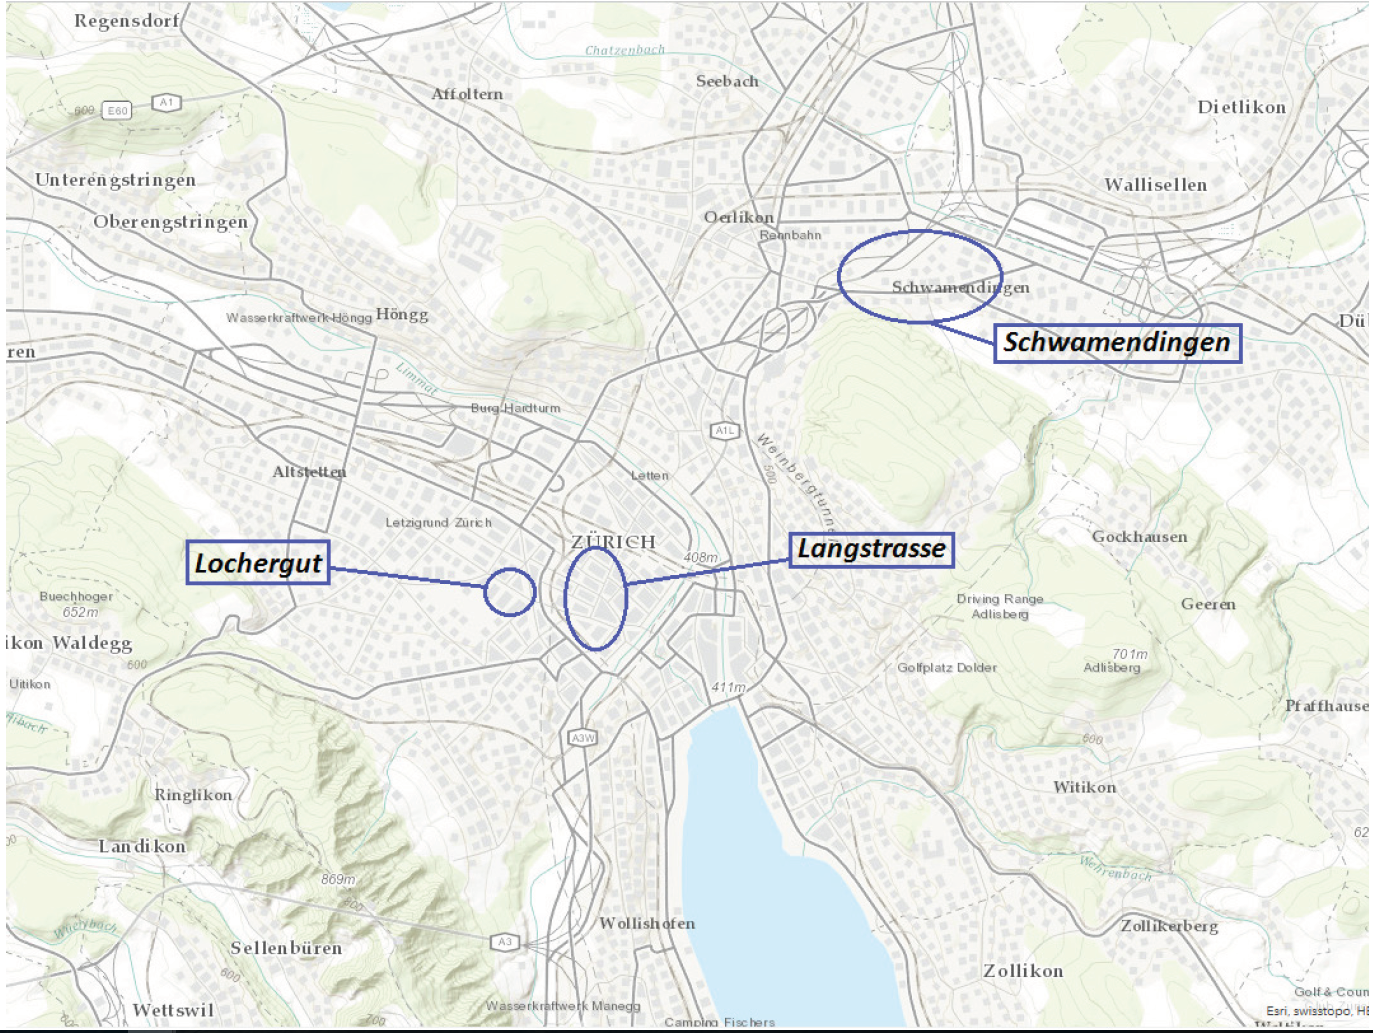
Most of the interviewees agreed that areas with low rents and high density of people living from social welfare would be the parts of the city with the highest vulnerability in the event of a disaster. Especially in quarters with many apartment buildings, the risk of social isolation was regarded to be high. Some of the respondents were able to name specific quarters or districts of concern, yet there was a certain level of disagreement in this respect. Mentioned were the Langstrasse area, the Lochergut in the central city and Schwamendingen (Figure 2). These findings confirm earlier research which found “low-status living areas are clearly segregated from high-status residential areas located mainly along the Lake of Zürich” (Heye and Leuthold, 2004).
Further, several experts raised the point that rising rents would increasingly force socially weak people to move from the city into the suburban agglomeration around the city (for example, Dietikon, Uster). Even so, several respondents highlighted that while segregation was increasing, the problems were not comparable to those in some other European metropoles, like Paris.
Besides residential areas with increased vulnerability, the experts interestingly also highlighted the importance of social institutions and meeting points for socially disadvantaged groups. In their view, the (temporary) loss of, for example, a local food bank or a homeless shelter, due to a flooding or another disaster, could have serious consequences for the users of these institutions. Further, also religious and cultural places are considered to be important, especially for ethnic minorities. These include, among others, cultural societies, churches, mosques and synagogues. In this context, it is interesting that several respondents suspected that areas where many conservative Muslims or orthodox Jews live might be vulnerable to disasters, but that their own knowledge about these groups was rather limited. As one expert explained, these groups tended to be isolated from other parts of society and also authorities had little contact with them: “They [the orthodox Jewish community] really live in their own world, for example in the Weststrasse area” (Interviewee 11). Similarly, the experts seemed to have little information on non-resident groups, such as Roma clans, which are irregular visitors to public places in the Zürich region, and have only limited contact with authorities or social services.
While for the above-mentioned groups there is at least a general understanding where they are located, the same does not hold true for a number of other vulnerable groups that appeared as relevant from sections 4.1-4.3. For instance, neither authorities nor non-governmental organizations have detailed knowledge about the whereabouts of Sans Papiers. According to our interview partners, these people are driven by the fear of arrest, living mostly self-reliant and are even not well-connected among each other. More generally, the state of knowledge about geographical hotspots of socially isolated people seems to be very low. While some experts con-tended that the issue of social isolation is particularly prevalent in large apartment houses with high turnover of habitants, others were rather unsure which indicators could be used to effectively locate this group.
5 Spatial Dynamics of Social Vulnerability in Zürich: Quantitative findings
Section 5 draws on the results of the qualitative analysis of social vulnerability, described in section 4. The authors demonstrate how knowledge derived from both quantitative and qualitative assessments of social vulnerability can be mapped with useful results for urban disaster managers. The work draws on three spatially explicit hazards in Zürich, and maps these against three proxies of social vulnerability: age, location of charitable housing, and points of social cohesion (for religious groups). The selection of the second and third proxies was based on the expert interviews and survey results, and reflects a Zürich-specific understanding of places where vulnerable people may live or gather.
Section 4 illustrated the necessity to consider the less tangible and non-spatial elements of social vulnerability. The section demonstrated that in gaining an appropriate understanding of social vulnerability, and where it exists, it is necessary to combine approaches that are complementary – where characterising the nature and location of socially vulnerable people or groups is not solely based on population statistics, but also on a qualitative description of vulnerability.
Three cases of spatially mapped hazards are examined in the context of aspects of social vulnerability highlighted in the qualitative results detailed in section 4. These include: the risk of chemical transport accidents near gathering points relevant to religious groups; the risk of flooding to social welfare housing; and, the risk of heat waves to the elderly members of the city.
5.1 Risk of Chemical Transport Accidents near Community Spaces
Zürich is not a centre of the chemical industry in Switzerland. Unlike the cities of Basel and Geneva, only one major chemical plant operates near the city (Sikabau), meaning there is little requirement for the movement or storage of large quantities of dangerous chemicals in the city. Nevertheless, dangerous chemicals are at times transported through the city, posing a potential risk, and this risk has been assessed and mapped by the Canton in order to better understand the potential impacts on the Zürich population living or working close to transport routes or storage areas, and, if necessary, to take preventive or preparatory measures.
5.1.1 Mapping Chemical Risk in Zürich
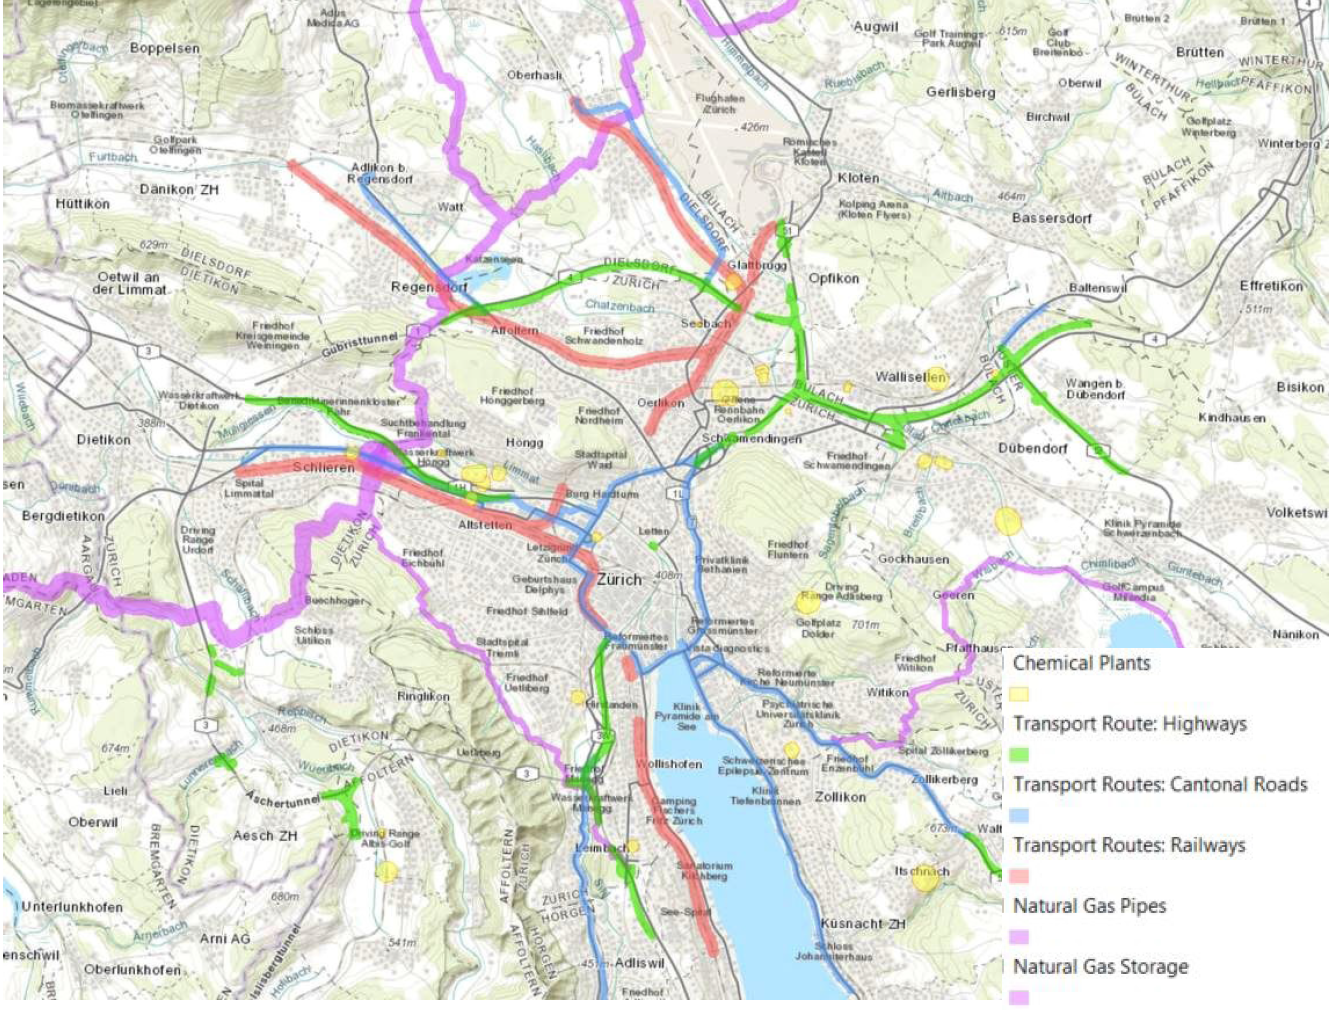
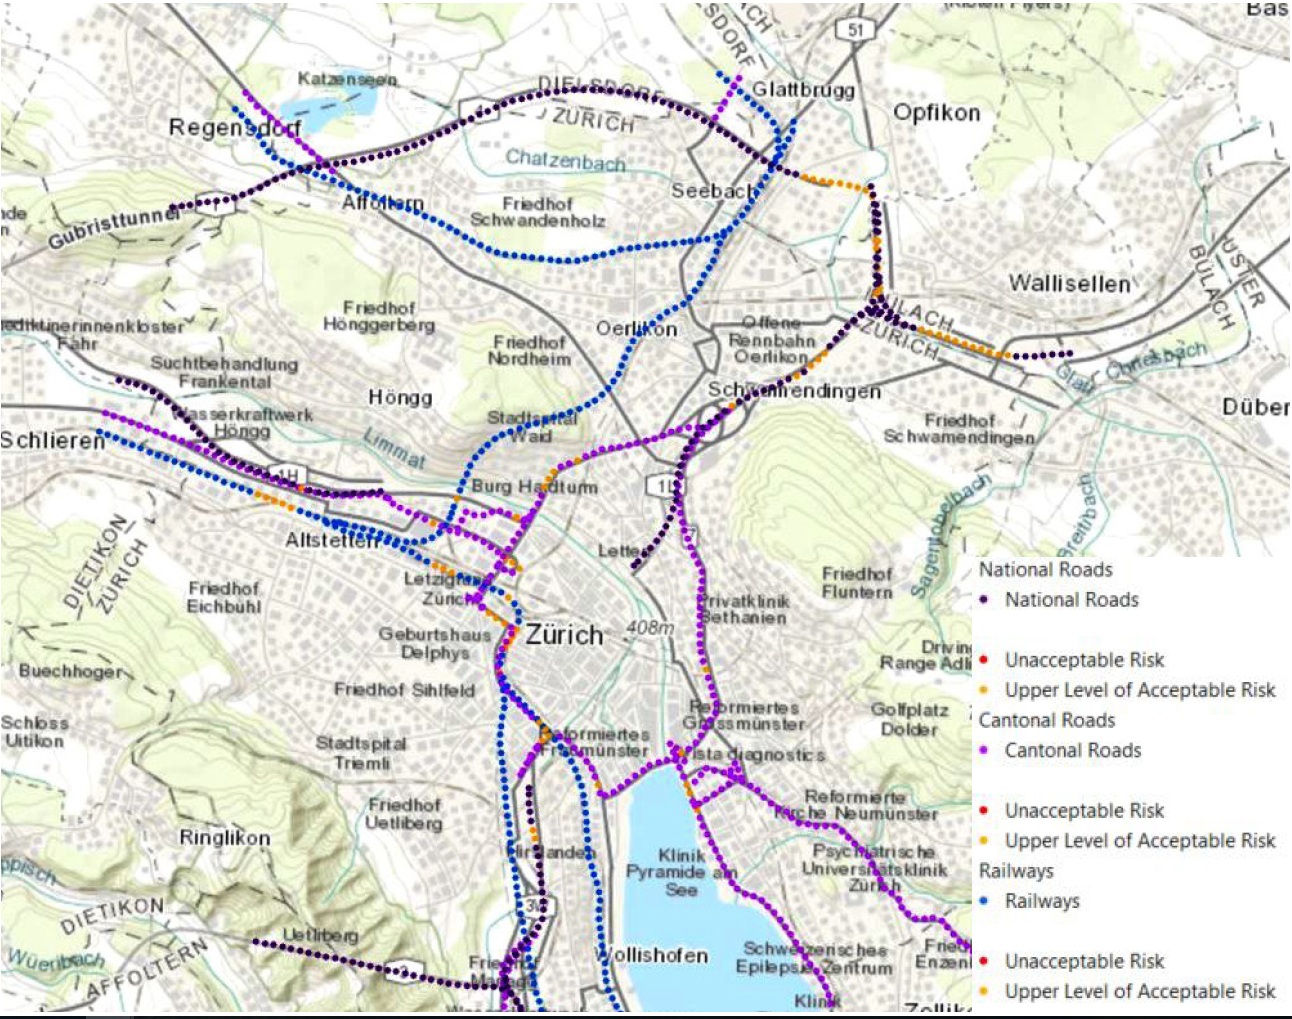
The Canton of Zürich’s Department for Waste, Water, Energy and Air (AWEL) has mapped the locations of all chemical storage areas and transport routes with the city. Included in this mapping are zones around these objects or routes that may be affected should a chemical accident occur (Figure 3). In fact, these ‘risk’ areas are actually consultation zones for spatial planning, based on a pre-defined distance from the routes or objects. In the case of the train routes, the upper distance of 100 metres from the lines was established in coordination the SBB (Swiss Federal Railways). This distance mainly reflects hazards of burning materials, which are considered to be most relevant.
While Zürich is not known as a centre of chemical industry, there are nevertheless several locations within the city limits where a spill or chemical fire could have serious consequences for nearby communities. Figure 4 highlights areas along national and cantonal roads, and along railway tracks, where the risk of chemical accidents has been assessed by the Canton.
If such an incident should occur, the population would most likely be alerted using sirens and radio announcements, and/or loudspeakers mounted on police cars, etc.
5.1.2 Synagogues and Mosques Exposed to Risk of Chemical Transport Accidents
The results from the expert interviews and surveys suggest that religious and social organisations tend to be important gathering points for their members living in Zürich, especially for immigrants and members of ethnic and/or religious minorities. For the purposes of this report, the authors chose to focus on the location of Muslim and Jewish religious buildings as points of interest where people might gather of which at least parts have little interactions outside their communities or with state authorities (see section 4.4). The exposure of these sites in relation to a relatively discrete form of hazard in Zürich (risk of chemical accident) is explored here.
Figure 5 illustrates that the location of synagogues, especially in the Enge quarter of the city, are relatively more exposed to chemical transport hazards than mosques in the city. Where mosques are, for the most part, located away from the centre of the city (being relatively recent additions to the city as the population of Muslim people has grown), Synagogues tend to be closer to the city, reflecting the reasonably long habitation of Zürich by Jewish people. As gathering points for the Jewish community in Zürich, targeting Synagogues in areas of chemical transport risk with relevant risk information would constitute a relatively easy measure to raise awareness about the potential risk present in the area.
5.2 Flood Risk and Charitable Housing
5.2.1 Mapping Flood Hazard in Zürich
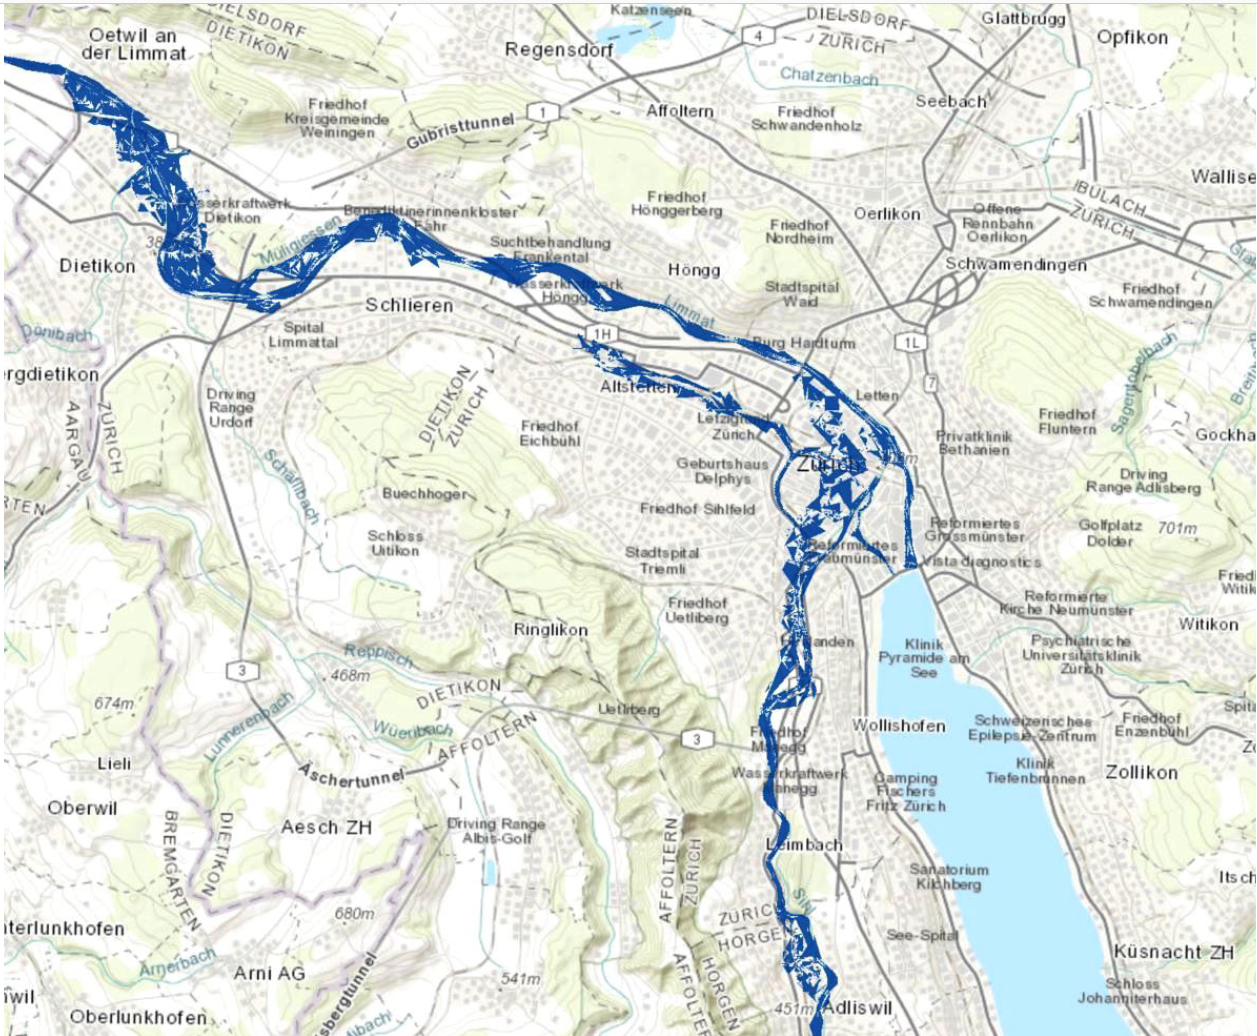
In 2016, the authors examined the relationship between flooding hazard in Zürich, and composite indicators of social vulnerability. In order to demonstrate the broad value of a social vulnerability perspective to disaster risk management, in 2016 the authors identified social vulnerability characteristics relevant to typical issues at each of the three phases in the Swiss model of disaster risk management: Preparedness; Response; Recovery. Flood has been mapped for the Canton of Zürich at a very fine scale (TK Consult AG), for two intensities: a 100 year flooding event, and a more significant 300 year flooding event (Figure 6). Given the extent of projected flooding is higher in the 300 year flood model, mapping for this extent is used in the current study. Given the significant flood protection measures in the city of Zürich, the extents of the 100 and 300 year floods differ only minimally.

5.2.2 Charitable Housing Exposed to 300 Year Flooding
Charitable housing was identified as a proxy for social vulnerability in Zürich based on results from the qualitative analysis of interviews and surveys with experts in Zürich. A majority of the interviewed experts stated that there is a particular vulnerability in areas with cheap rents and high social assistance rates. In particular, interviewees and survey participants identified specific neighbourhoods, including Langstrasse, Lochergut, and Schwamendingen (see section 4.4). In addition, due to the high rents in the city of Zürich, many social weaknesses are moving into agglomeration areas (e.g. Dietikon, Uster).
In this context, when discussing charitable housing, the authors are referring to residential building stock where rental fees have been subsidized (either by the City of Zürich, or by the building owners). City representatives estimated that, in fact, just 10% of the charitable housing stock is occupied by residents who must meet certain socio-economic criteria (e.g. low income) before they are accepted as residents. As such, charitable housing, in this sense, is seen as a very loose proxy for social vulnerability, but one that could be strengthened with additional information. Consequently, the authors make only very generic inferences about the relationship between flood and ‘charitable housing’.
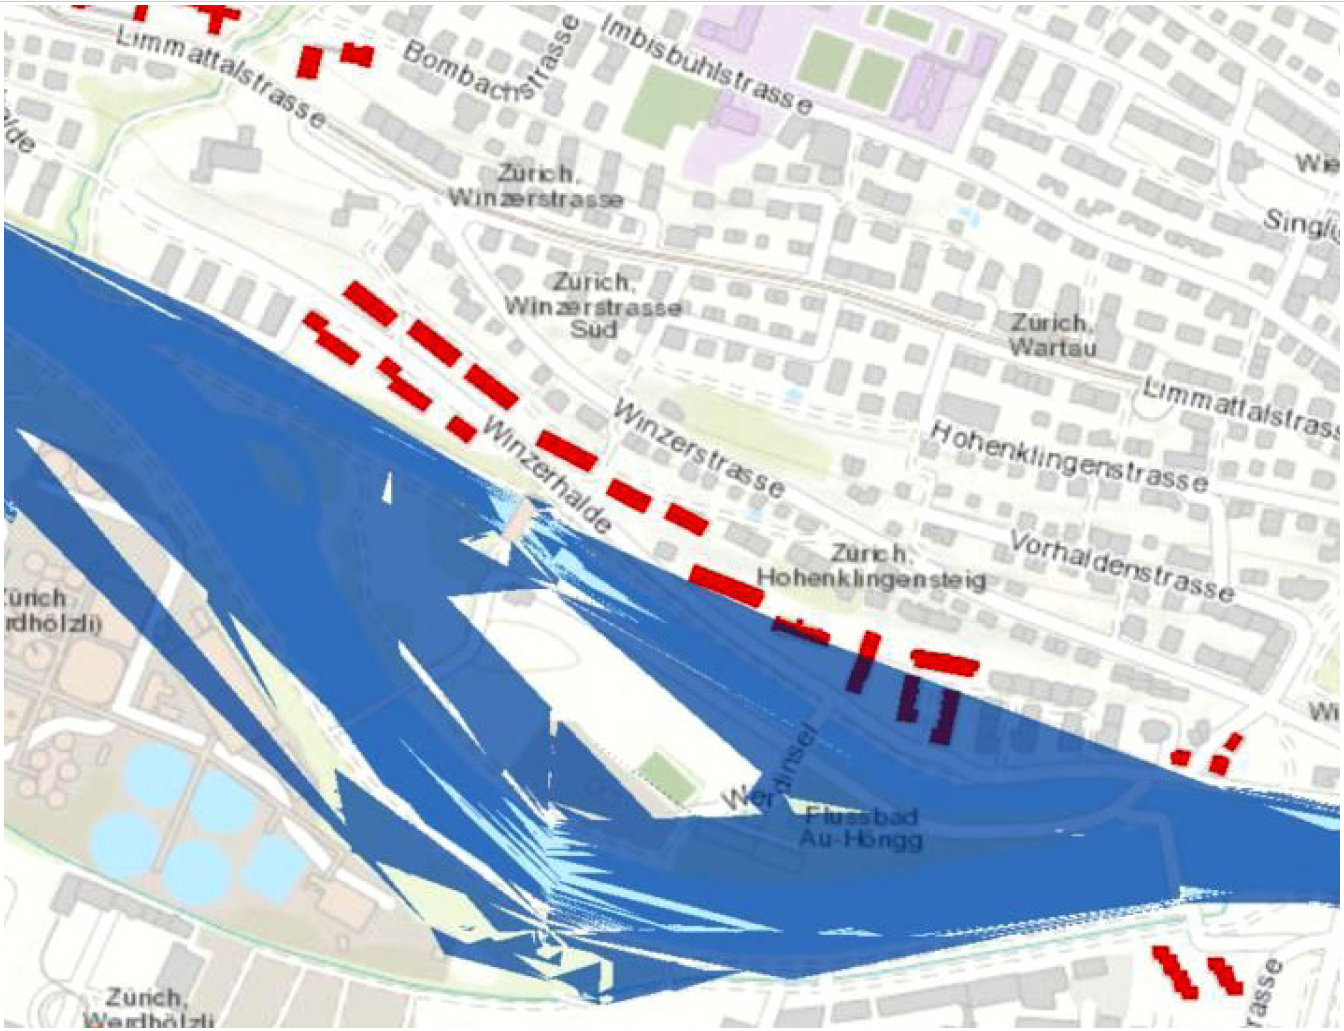
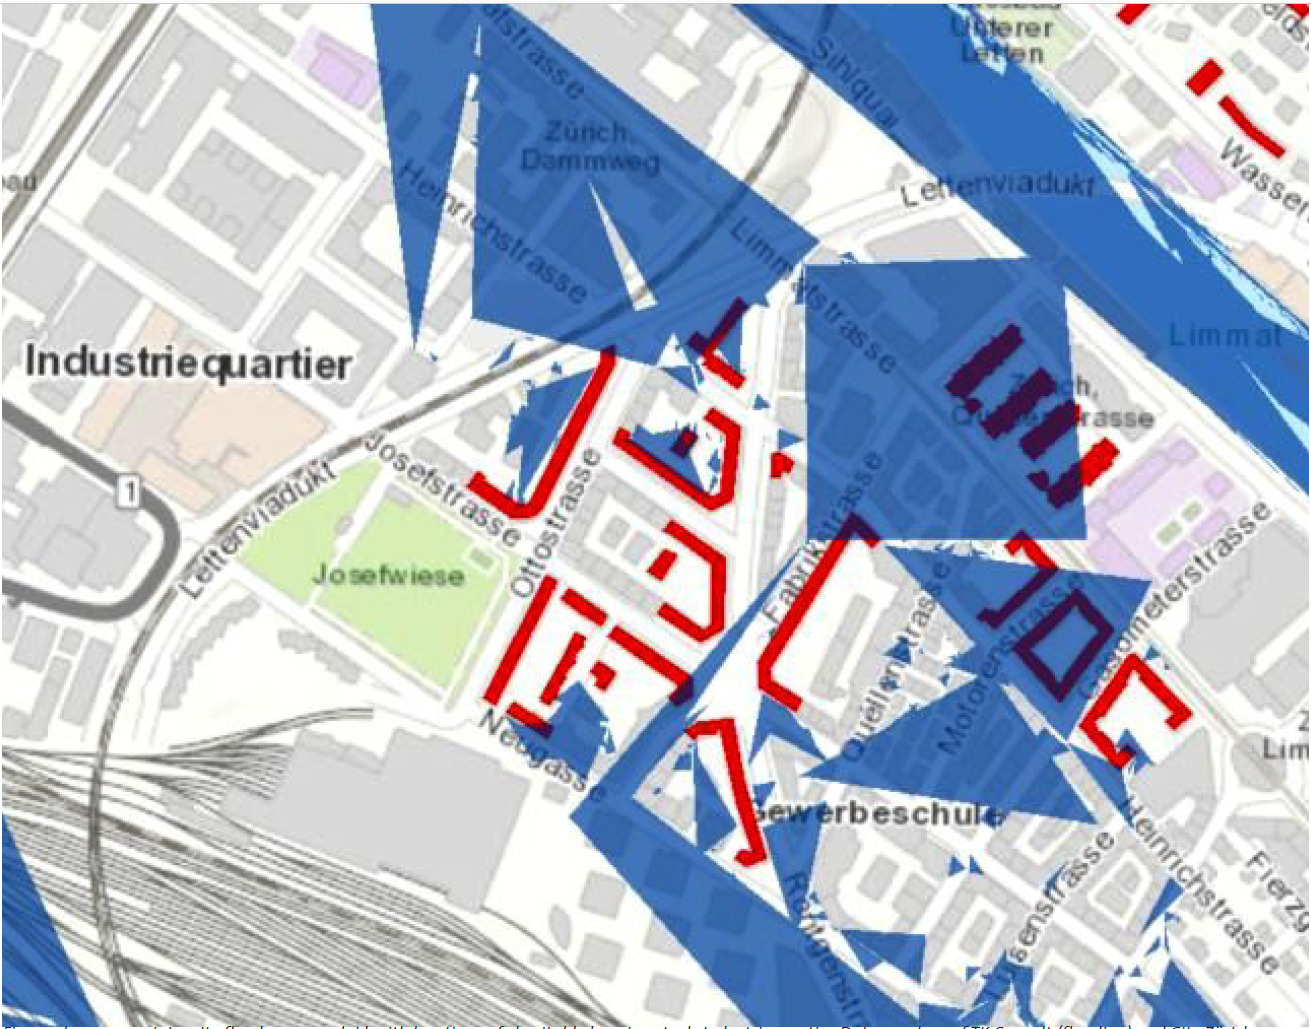
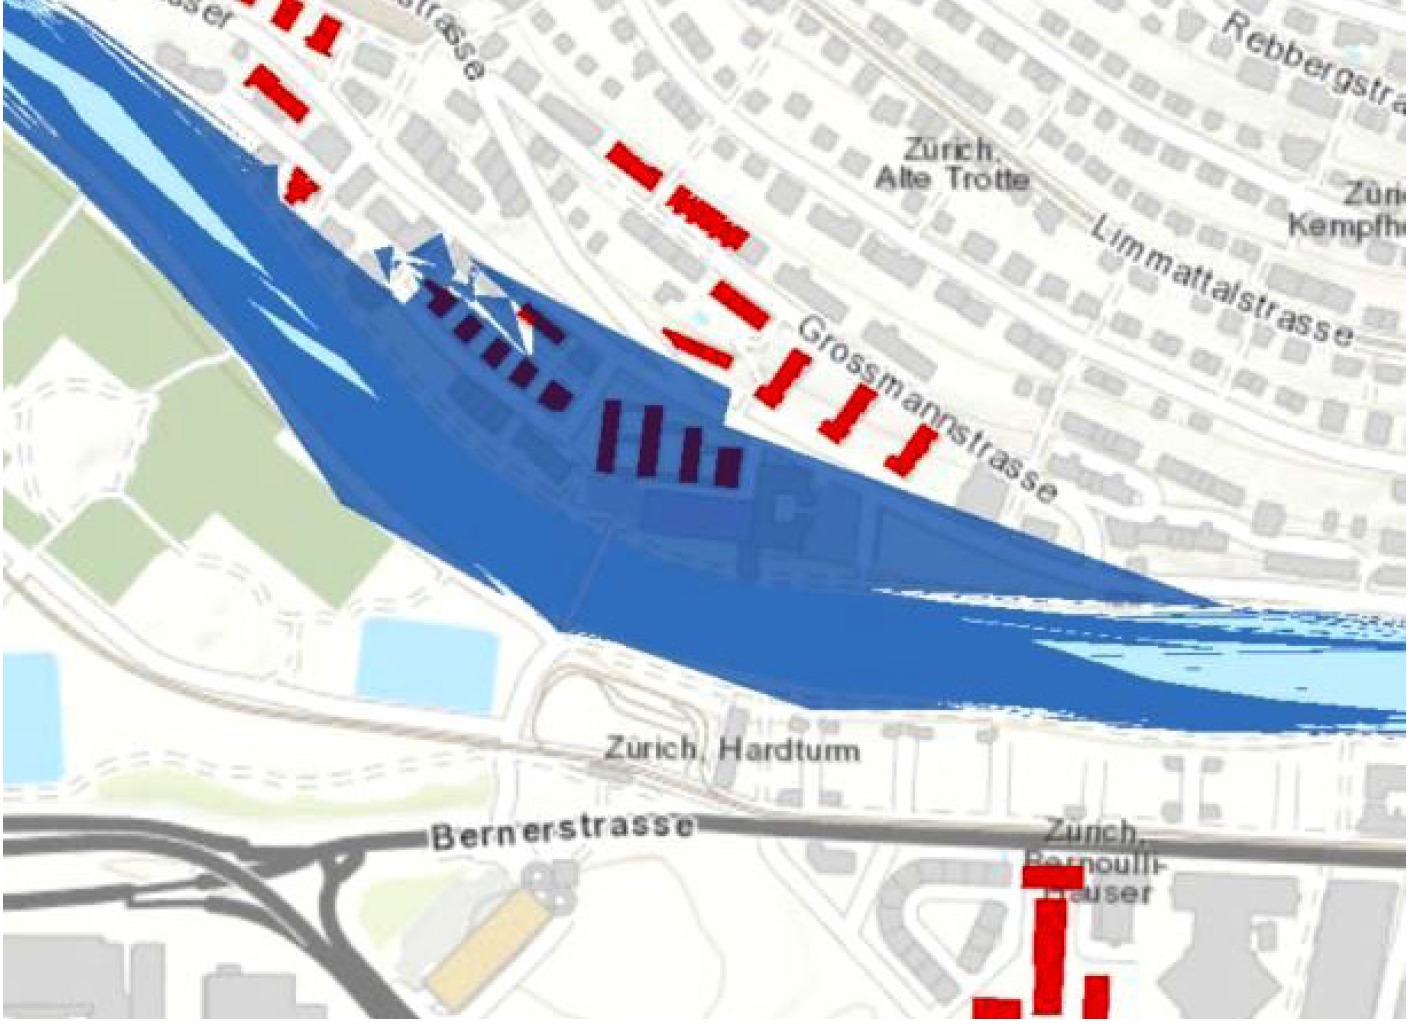
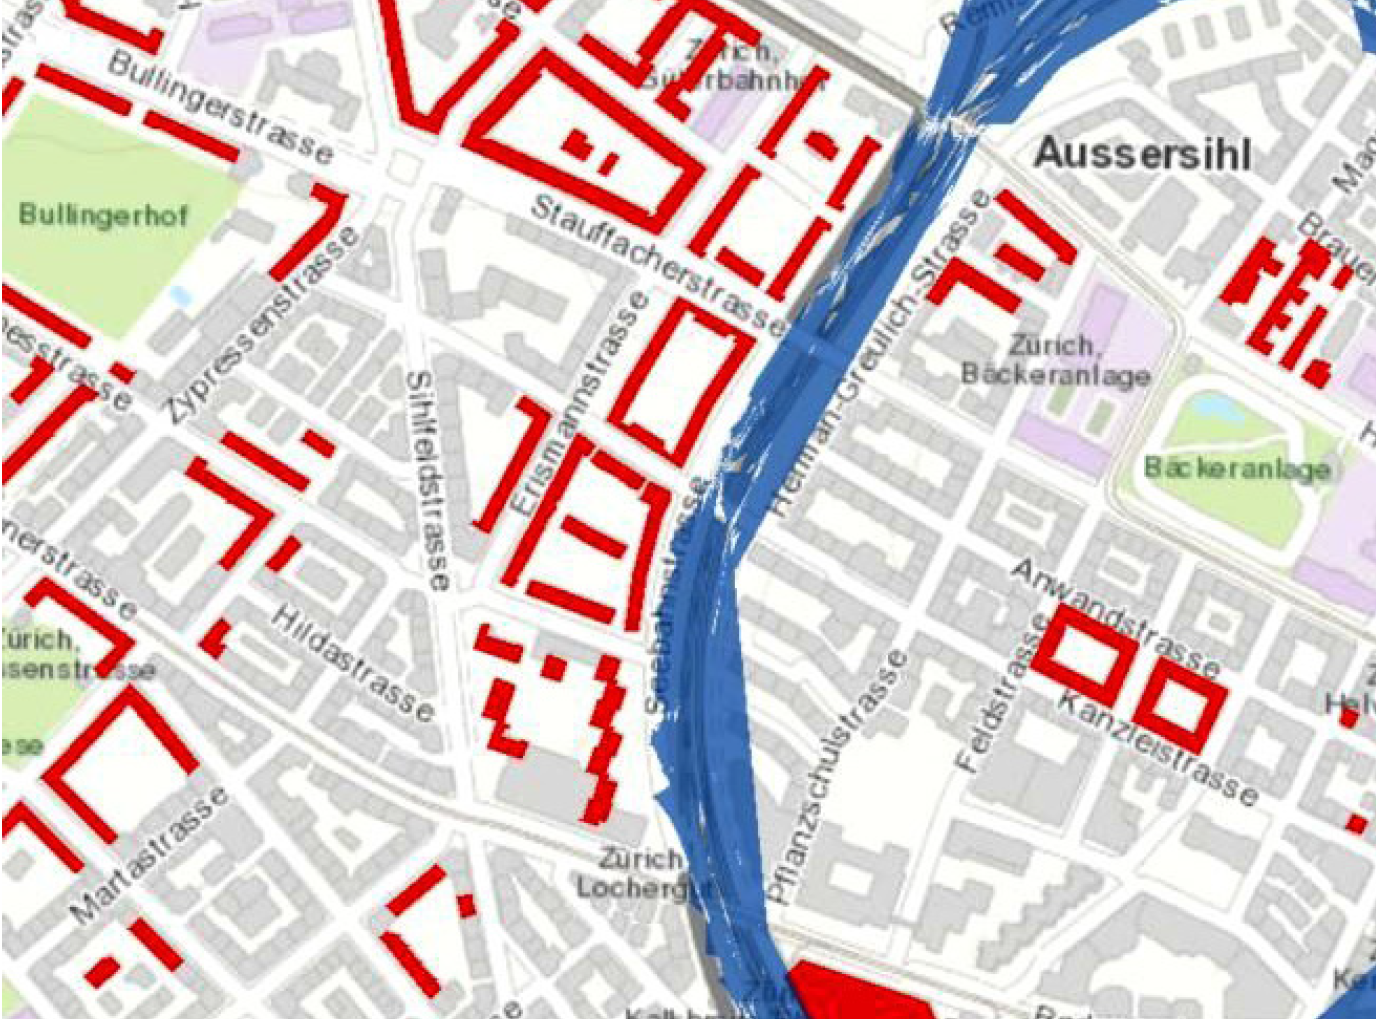
While flooding is quite closely controlled within the city, four areas of Zürich with relatively dense charitable housing stock include: the Lochergut, the Industriequartier, the Grossmannstrasse in the vicinity of the Limmat river, and the Imbisbühlstrasse / Werdinsel area. Figures 7a-d show these parts of Zürich where flood waters (blue colour in figures) in a significant flood event (once in 300 years) would impact areas of charitable housing (red colour in figures). The results from the geo-graphical analysis could be used to inform targeted disaster management efforts for these areas, such as flood preparedness campaigns for local communities.
5.3 Risk of Heatwave among Elderly Residents of Zürich
Heatwaves are a reasonably common event in Switzerland. Research conducted in Switzerland following the heatwave event of 2003 demonstrated that the event caused an average increase of 7% mortality during the heatwave episode (Grize et al., 2005). This work, and more generic morbidity research relating to heatwaves, demonstrates that of the population, in particular the el-derly, infants and people of low socio-economic status are most affected (Basu and Samet, 2002).
Zürich was not seriously impacted during the 2003 European heatwave, with few ‘very hot’ days (>32OC) occurring sequentially (unlike Geneva and Basel, where temperatures remained high for 10 days or more in both places). However, in 2015, the city experienced three episodes of prolonged heat (actually impacting the whole of the country), the worst of which occurred at the beginning of July, resulting in 11.4% excess deaths across the whole Canton (Vicedo-Cabrera et al., 2016). This work demonstrated that during the most intensive period of hot weather, excess mortality rates in people age between 75 and 84 years was the highest, at 9.7%.
5.3.1 Mapping Heat Islands in Zürich
Recent collaborative research conducted between the Chair of Building Physics at the Swiss Federal Institute of Technology (ETH) and the Atmospheric Modelling group at the Swiss Federal Institute for Materials Science and Technology (EMPA) has sought to model the ‘urban heat island intensity’ (UHII) in the city of Zürich. The UHII is influenced by the several factors: the heat-absorbing nature of buildings and other dark structures in the city, the limited amount of green space, and the propensity of buildings to block wind. These factors mean that heat dissipates more slowly in cities, and in situations of prolonged daytime heat, cities becomeconsiderably warmer than surrounding sub-urban and rural areas.
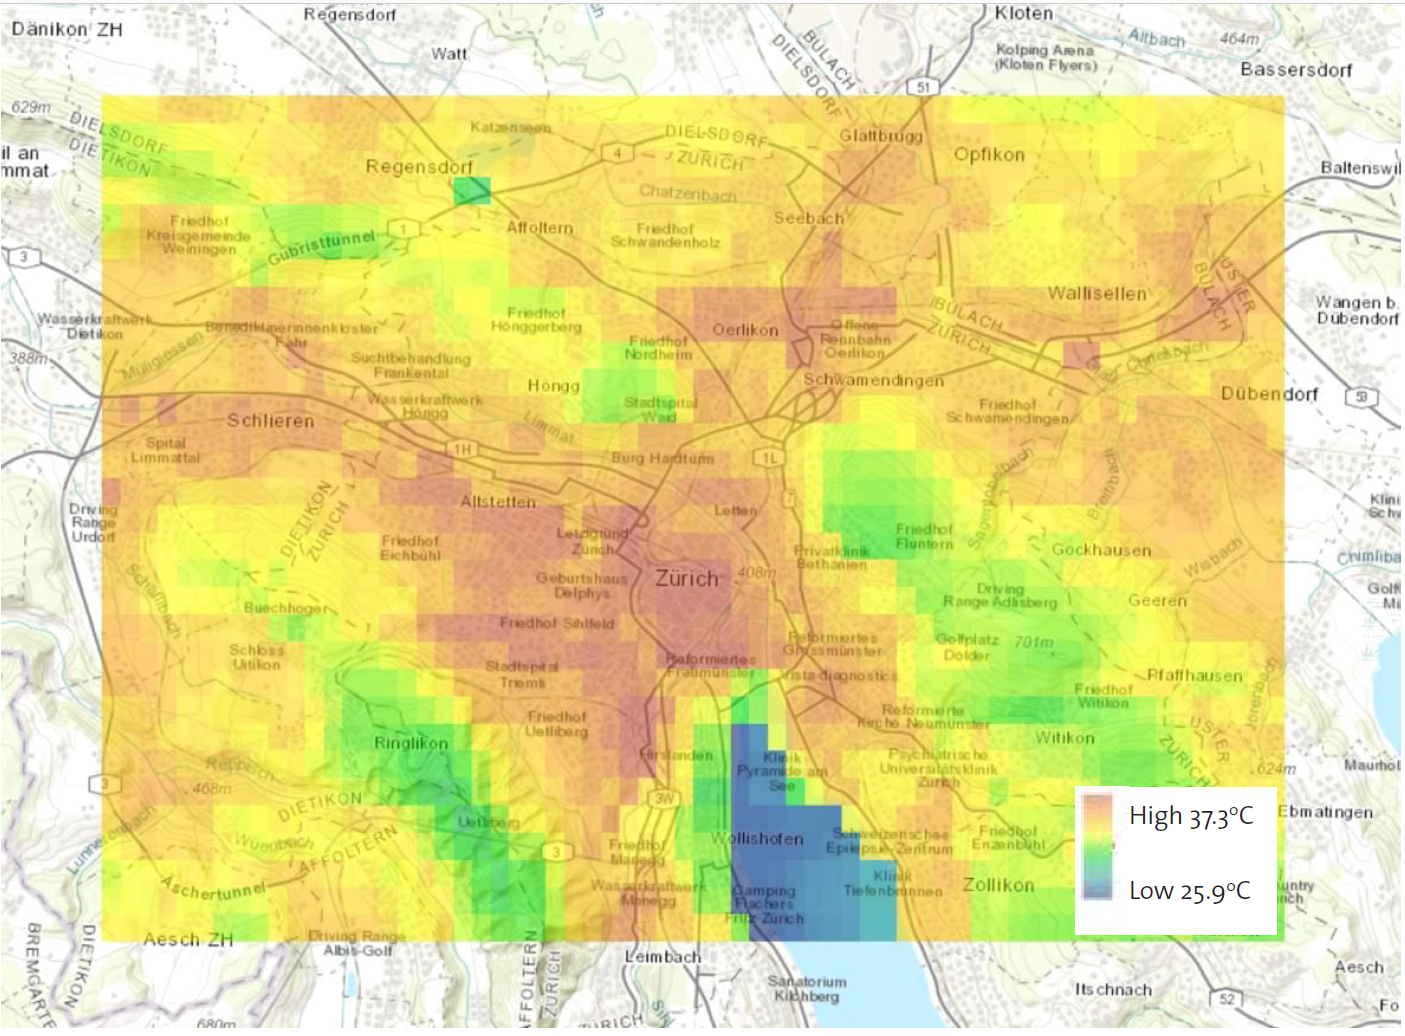
The result of the collaboration between the ETH and EMPA is a simulation model of urban heat at two meters elevation above the ground (Figure 8). The simulation model is bounded by actual temperature recordings made at a limited number of weather stations within Zürich. The simulation provides an efficient means of estimating heat without installing a dense (and costly) network of temperature measurement stations.
As would be expected, based on the urban heat island theory, the central part of the city where building density is highest, and green space is most limited, simulated heat at 2m above ground level is highest. The more densely built areas of Oerlikon and Bulach also show above average temperatures. Coolest simulated temperatures are understandably located along the Limmat, and in the green spaces on the Uetliberg and the Zollikerberg.
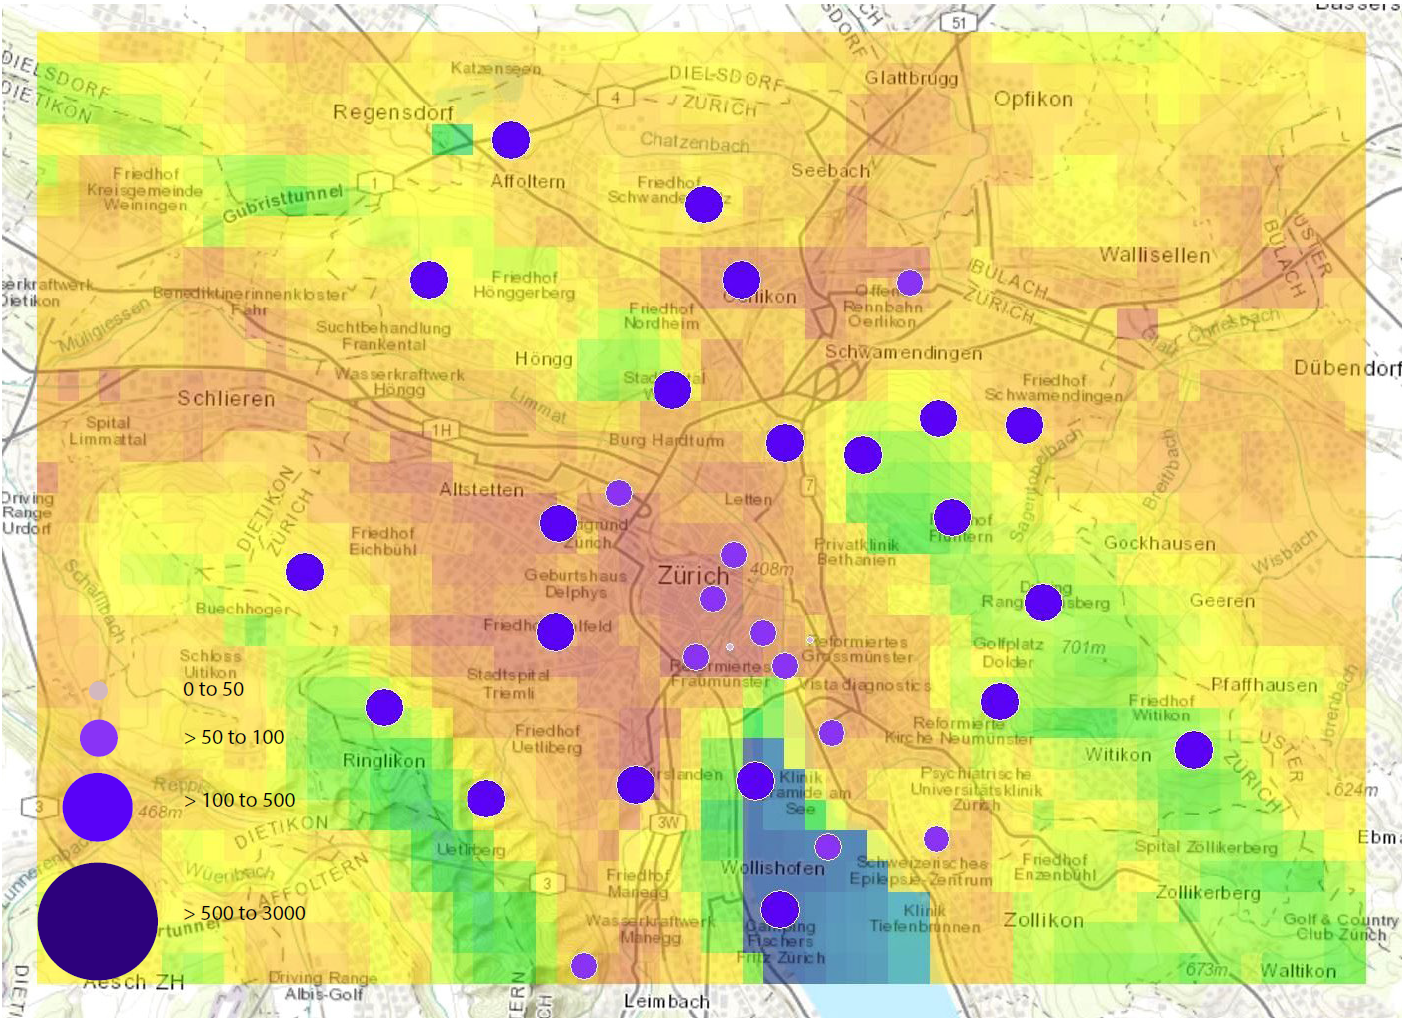
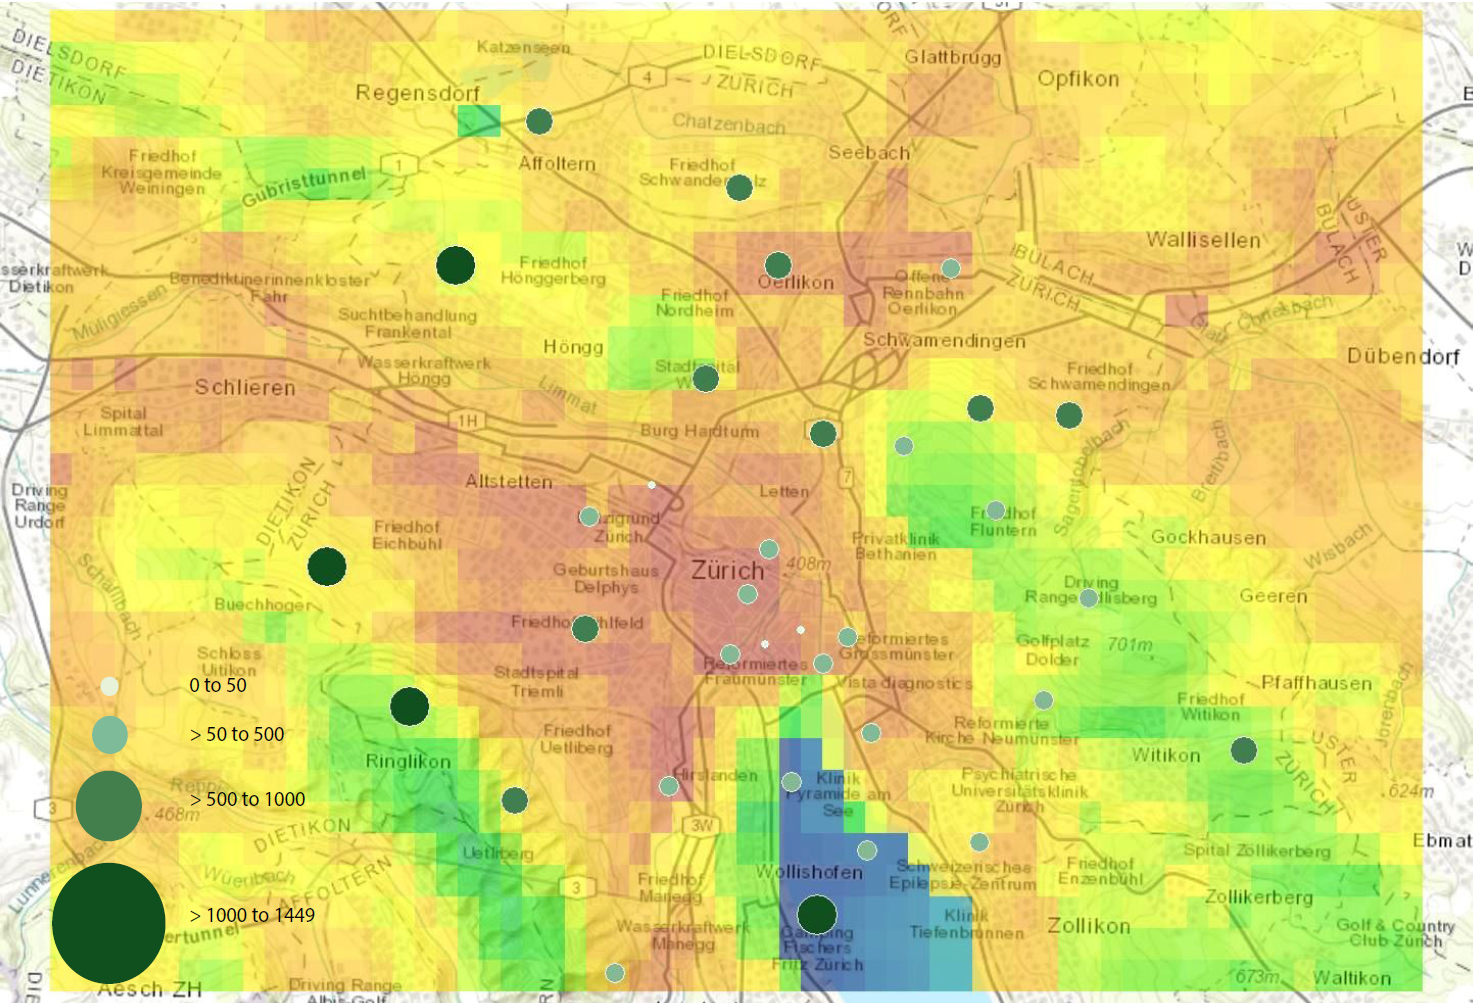

5.3.2 Elderly People Exposed to Heat Waves
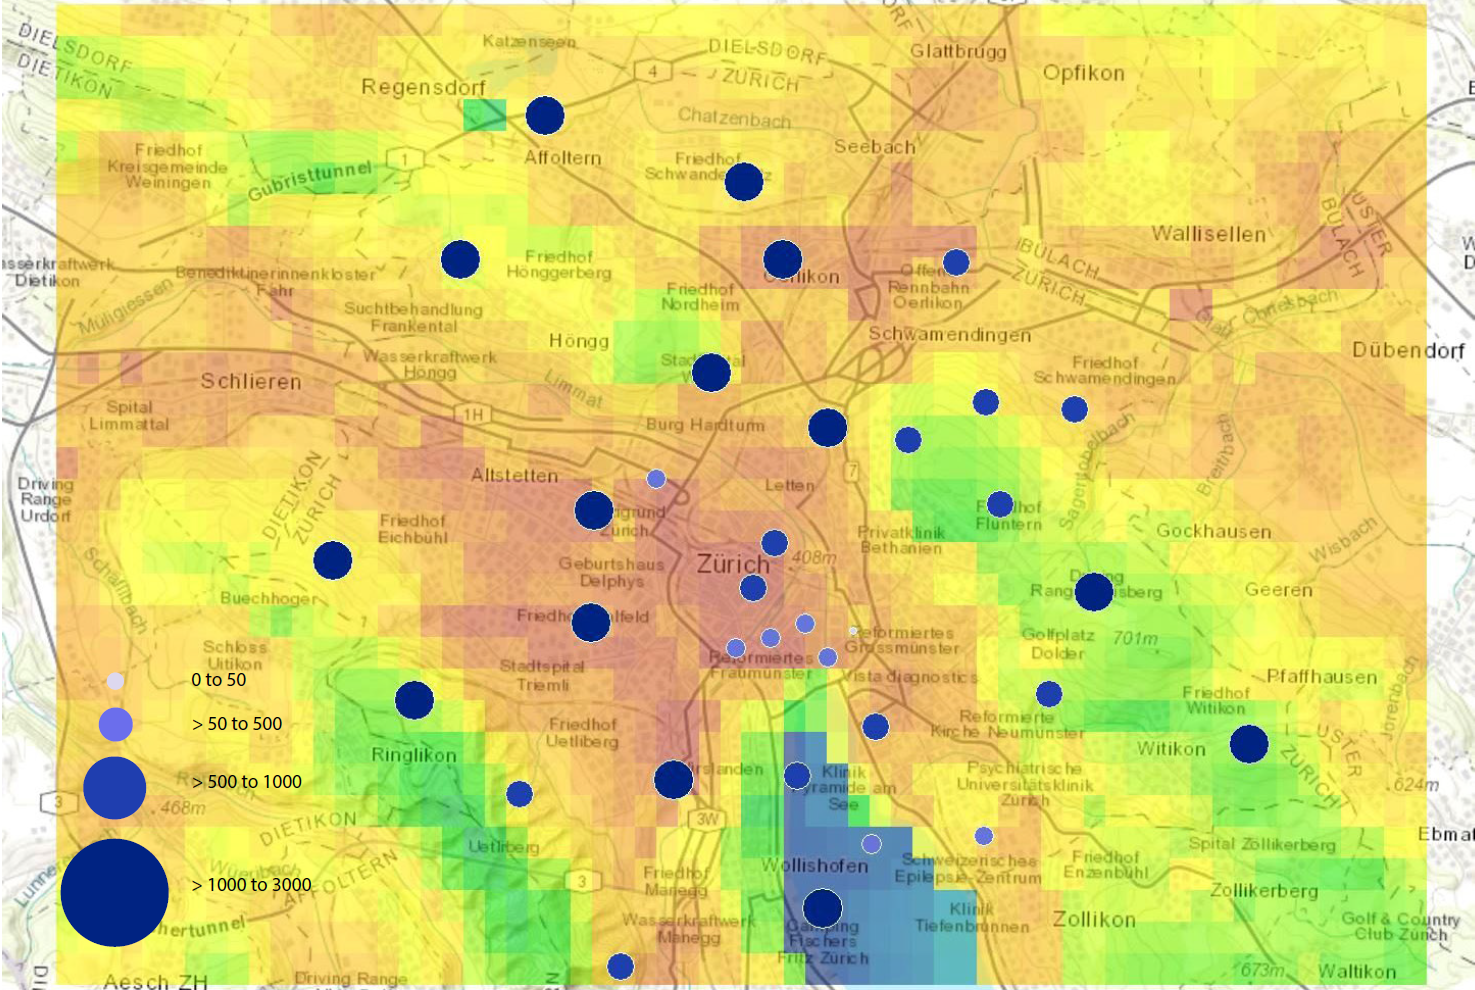
Zürich residents (female and male) older than 60 years are mapped based on data available from the city of Zürich’s Open Data Portal (Figure 9a-d). In this analysis, male and females are not separated for the analysis, but are aggregated into four age classes: 60-69, 70-79, 80-89, and 90+. In this instance, the authors chose to examine a simple two-way relationship between areas of the city susceptible to heat waves and age. Given the demonstrated relationship between heat waves and increased mortality in the older population, this comparison is of particular relevance.
The areas of Altstetten, Wiedikon, Aussersihl, Industriequartier and Oelikon are among the most densely populated quarters of the city, including with respect to the elderly. Given the density of buildings in these places, they are also the most likely to be affected by a heat wave in the city. As would be expected, the number of people aged between 60 and 79 years living in these areas of higher heat wave risk is greater than people aged 80 and above.
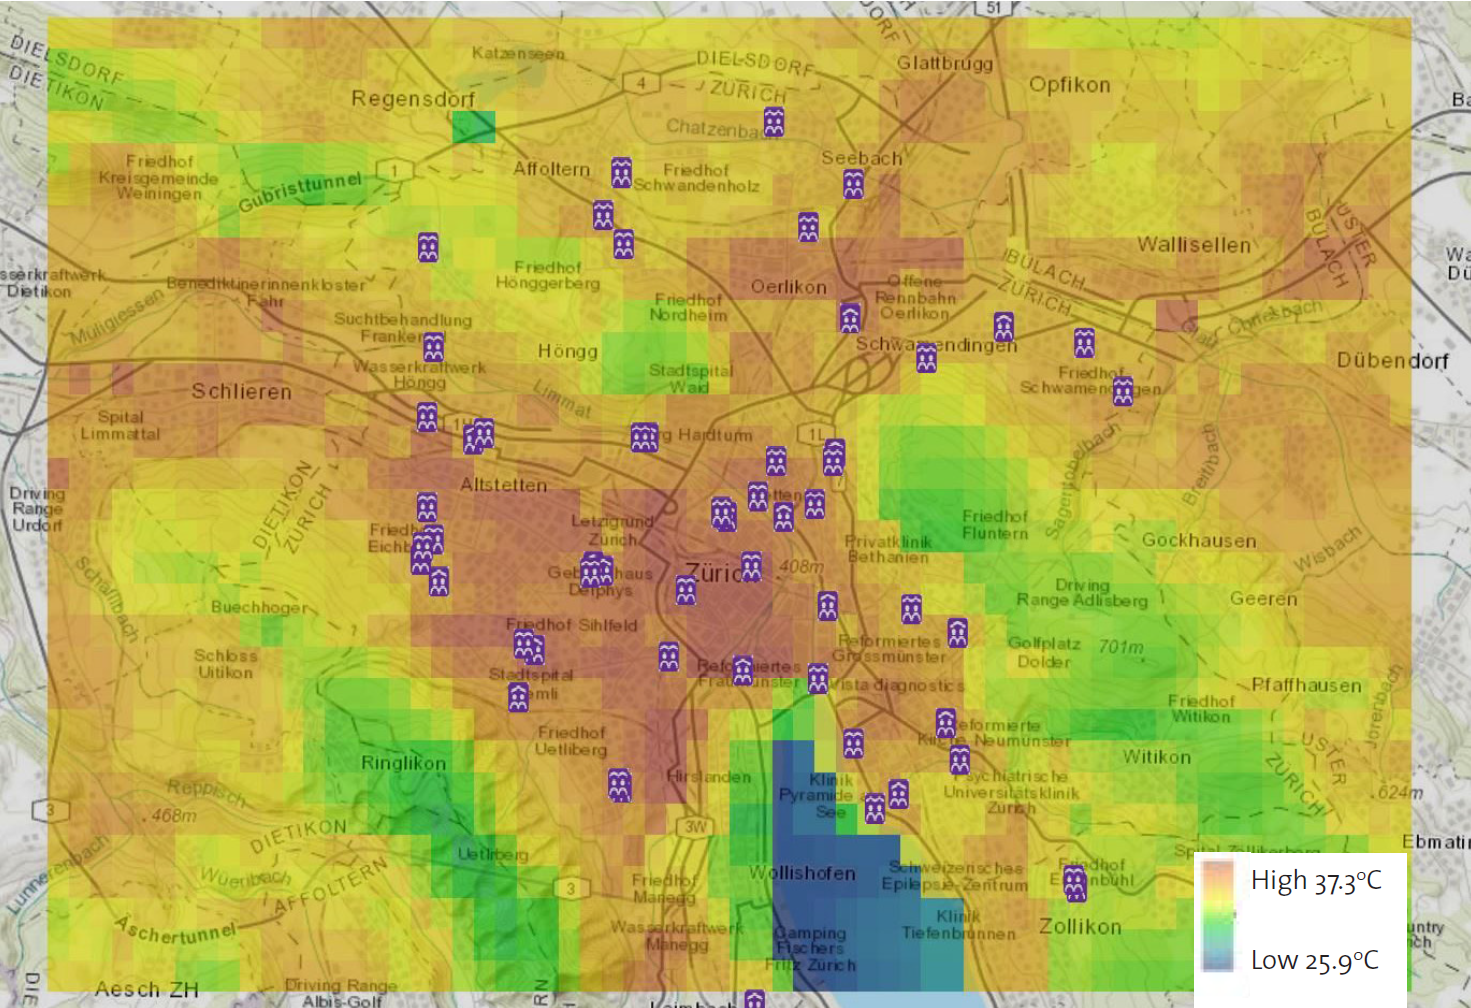
While Figure 9 highlights the distribution of elderly people with respect to simulated heat wave intensity, the information is not hugely useful in identifying areas where more effort might mitigate heat wave hazard consequences among the elderly. Figure 10 specifically highlights the location of places where the elderly are cared for, or live in supported living arrangements. Almost all of these centres are located in areas of high or moderately high heat wave risk. While this is disturbing from a risk perspective, the concentration of elderly in these places provides an opportunity to distribute information about mitigating the effects of a heat wave in a systematic manner.
6 Conclusions and Implications – Actions to Address Social Vulnerability in Zürich
There are three key ideas that can be drawn from this context-specific assessment of social vulnerability in Zürich. First, that a first step towards understanding vulnerability with respect to hazard extremes can be achieved by studying vulnerability in the every days lives of the population. Second, that mapping vulnerability quantitatively can be helpful in locating vulnerability, but without a deeper examination of what causes vulnerability in a particular place, it is difficult to truly understand what vulnerability actually is, and who is vulnerable. Lastly, that the nature of vulnerability is in constant flux, and static ideas of who is vulnerable, and where they live, may not serve disaster managers effectively.
6.1 Hazards and Social Vulnerability – Dealing with Extremes?
Disasters are extreme events with terrible impacts on society. As such, discussions about disaster management and civil protection often centre about this extreme nature of the events. This also influences the way we think about peoples’ vulnerability to hazard – that it is the disadvantaged people at the margins of society who are typically most vulnerable, and at risk from these extreme events. While disadvantage certainly can be associated with vulnerability, this study has demonstrated that in fact, people who are ‘vulnerable’ because of more mundane characteristics in their everyday lives are oftentimes also those most likely to be vulnerable to the natural and technical hazards examined in this project.
In this sense, the results highlight that focussing on very broad (and hazard-specific) vulnerability characteristics can give a misleading picture of vulnerability. This is especially the case when vulnerability exists as a factor in the everyday lives of people – factors that may be overlooked if the focus of vulnerability is directed at potentially more extreme characteristics. Instead, a detailed analysis of the specific capabilities and requirements of various social groups is required to gain a social context-specific picture of vulnerability. This can serve as the basis for tailored disaster management strategies.
Ultimately, this research project identifies that knowing who is vulnerable in daily life is actually a productive first step in knowing who’s going to be vulnerable in a disaster situation. Importantly, however, these everyday vulnerability factors may not be the traditional socio-economic indicators, and the following two sub-sections detail two particular everyday vulnerability characteristics that are important in the City of Zürich.
6.1.1 Social Isolation and Vulnerability
Existing research examining human factors in disasters has identified the importance of social cohesion in disaster events (Carroll et al., 2005; Barrett et al., 2011; Bihari and Ryan, 2012; Prior and Eriksen, 2013). This work highlights how social cohesion plays a role in supporting individuals throughout the disaster cycle – in preparedness before an event, during the event, and in post-event recovery. The results of this project support these notions, highlighting that people who are socially isolated, without a strong social network, are the most likely to be vulnerable to hazards in Zürich. This is particularly the case for those who are unable or unwilling to break out of their social isolation even under such extreme circumstances as a major disaster, mostly because they are afraid to accept or even ask for help, such as lonely old people with onset of dementia, migrants without legal residence as well as people with mental health problems.
The results demonstrated that classic socio-economic indicators (age, income, heath, education, etc.) can actually drive social vulnerability through social isolation. Alone, these factors may not influence social vulnerability significantly, and Prior et al. (2017) demonstrated the importance of examining component socio-economic indicators of social vulnerability. The results of the current analysis illustrate that, in fact, such characteristics like older age, poor mental health status, ethnicity, working style (part- or full-time), or foreign language may actually be factors that can lead to social isolation. By increasing the risk of social isolation, these “classical” characteristics indirectly put people at greater risk of disaster, even though they may not be directly linked to social vulnerability.
The issue of social isolation highlights the importance of government actors in the context of social vulnerability. As outlined in section 4.3, significant progress has been made reintegrating previously socially isolated members of the city community, especially with respect to drug policy, prostitution, and homelessness. First identifying, and then finding ways to improve the relationships between marginalized social groups and state authorities, must be two important aspects of disaster management in the city.
The results also identify that well-organized and self-aware social, cultural, and religious organizations could be valuable first points in the community that authorities might leverage communications with population groups that might be otherwise hard to reach. Building bridges to marginalized groups, especially through trust-building, will be an important future step in better connecting to, and understanding the needs of itinerant members of the Zürich population (like the sans papiers or Roma).
6.1.2 Falling between the gaps
By tackling the issue of social isolation, government authorities can limit the number of people falling between the social security ‘gap’. This was another important finding of the project: that individuals who are judged (by social assistance experts) to be vulnerable are typically those people who are not supported by Switzerland’s (mostly) very effective social security networks.
However, trying to reduce social vulnerability to disasters must be considered a broader activity than merely extending existing social welfare policies. For the most part, state- and cantonal-based activities in social welfare are distinct from state- and cantonal-based activities in disaster management. The results of this project suggest that finding ways to integrate adjustments to social welfare systems to prevent people falling through the gaps, and becoming socially isolated, for instance, will also contribute to better disaster management and mitigation. In this context it is important, again, to highlight that disasters are in fact social phenomena (Quarantelli, 1992; Tierney and Oliver-Smith, 2012), so finding social mitigation solutions should be considered fundamental practice in disaster management.
In general, we should be careful when labelling people as socially vulnerable or invulnerable using a broad brush, based on a few general indicators. At best, such an approach can provide a rough approximation of the real social situation. Yet, as far as possible, the specific capabilities and requirements of each person should be considered. To meet these capabilities and requirements, tailored strategies are required that address the specific challenges that hazards pose to different parts of society. Without a context-specific understanding of exactly what these needs or capabilities might be, the disaster manager’s effectiveness will be severely compromised.
6.2 Improving Institutional Responses through Mapping
Research by the authors in 2016 (Prior et al., 2017) demonstrated the utility of mapping in the context of understanding the spatial dimension of social vulnerability in Zürich. What the work of 2016 lacked was a contextually specific conception of what social vulnerability actually meant in the context of Zürich, rather drawing from the international literature to characterise vulnerability.
Results from this project demonstrate that while some aspects of social vulnerability can be mapped, others are less tangible. For instance, the distribution of the elderly, or people living in charitable housing in quarters where the socio-economic status may be lower than the city average, can be mapped quiet easily. For these factors, there tends to be quiet detailed information available from both the City and Canton Administrations.
By contrast, qualitative interviews and surveys with city, cantonal and NGO representatives working in the social support professions highlighted that other important aspects of social vulnerability cannot be quantified. For instance, quantitative information does not exist for people who are not registered inhabitants of the city. Itinerants (for example, Roma folk) and illegal inhabitants (Sans Papiers) are considered to be especially vulnerable people in Zürich, but not knowing their status, or where they live, prevents authorities from providing them the support they might need in a disaster situation. This deficiency suggests that knowing what can be mapped must be complemented by the recognition that mapping is not the only solution in addressing social vulnerability in the city, but is only one tool in the disaster manager’s toolbox.
6.2.1 Tangible vs. Intangible Factors of Vulnerability
Fortunately, both the Zürich City and Canton subscribe to the philosophy of open data. As such, the authors have benefited from the availability of a great deal of spatially explicit social and hazard information. However, in identifying usable data sources, and from the results of the qualitative analyses conducted as part of the work, it is clear that there are important social data and hazard information that are not spatially represented or understandable.
In 2016 component quantitative indicators were used by the authors to understand vulnerability. This approach was improved in 2017 by conducting a qualitative exploration of what social vulnerability specifically means in the city of Zürich. This work highlighted several factors (like culturally important gathering points, age, and the location of charitable housing) that can easily be mapped, and have been examined in the current report against spatially explicit hazard information. At the same time, the work also highlighted non-spatially explicit, but equally important, factors that drive social vulnerability in Zürich – especially social isolation. While isolation, as a social characteristic of an individual or group of people, can be estimated indirectly (as outlined in section 4.3), its qualitative nature makes it difficult to measure, and therefore, difficult to map. This suggests that finding ways to measure qualitative aspects of social vulnerability could be a useful first step in mapping them. At the same time, it is important to determine if investing in the effort to establish measures for the less tangible elements of social vulnerability make sense in the context of how valuable those investments might be in improving mitigation.
The research process used in this project also highlighted that not all hazards can be represented spatially. Two hazards that the research team considered examining in this project were blackout and pandemic. Both hazards obviously have spatial elements, but the complexity determining their potential geographic extent, and therefore who might be at risk from the hazards, is almost impossible to determine at the disagregated level. In the case of a blackout in Zürich, the huge complexity of the energy system in and around the city, and the uncertainty surrounding how a blackout might originate and spread, meant the case was avoided. The situation is similar for a pandemic, where too many factors determine how a pandemic might establish and spread throughout the Zürich population.
6.3 Building Organisational Resilience
6.3.1 Understanding Social Dynamics for Organisational Adaptability
Disasters are social phenomena, and understanding social vulnerability should be a fundamental step towards efficient and effective disaster risk management. Given that society is dynamic, disaster managers must also adopt adaptive and flexible approaches to understanding how societal changes might influence social vulnerability. A knowledge of the way social vulnerability changes in the context of broader societal developments can also provide the basis on which authorities can better integrate social welfare information into disaster management practices, but also to better include vulnerable groups of people into those same activities. One first important step here is to better use the information about social changes and the location of socially vulnerable groups that already exists within the Zürich city and cantonal administrations. Mapping this information should play a role in the future of civil protection in the city.
Swiss civil society is fundamentally dynamic. Not only is the society changing in the context of its social structure (age and ethnicity, for instance), but also in the context of technology (digitalisation and communications, for instance). These changes influence the efficiency of existing approaches to disaster management and civil protection. Responding effectively to these changes will increasingly determine how well civil protection services can be provided by Swiss authorities to the population in the future.
Civil protection practices must acknowledge and adapt to these changes. This implies the need to embrace change – for instance in communication, Swiss disaster management authorities may better serve the population through direct communication with and for the population (Maduz et al., forthcoming). Closer relationships with the population, through direct communication, can improve an understanding of social vulnerability, and ensure organisations are capable of responding in a timely manner to the dynamic nature of society. The growing issue of social isolation in the city is an example where understanding population dynamics will improve the ability of organisations to respond to the needs of the public in the case of a disaster.
6.3.2 Organisational Preparedness
Many vulnerable groups are heavily reliant on social support from the City, Canton, and/or non-government organisations. Research conducted in this project has demonstrated that experts in the social welfare field in Zürich are concerned about how well social support organisations could weather hazard events. If these organisations are negatively impacted by hazard events, then the socially isolated population members they support will be left with no social support at all. By incorporating an understanding of changing social dynamics, and the changing demands this places on social welfare and other support activities, social support organisations can increase their preparedness through contingency planning and business continuity management.
6.3.3 Creating a Network
The results suggest that social vulnerability can be most effectively addressed by a network of various governmental and non-governmental actors. Above all, actors in the social welfare domain and disaster management must be better integrated. The results of this study indicate that fostering ways of integrating the work of social organisations with disaster management practices could be an efficient way of acknowledging and addressing social vulnerability in Zürich. Among others, a stronger relationship between civil protection and social welfare authorities or non-government organisations can yield a deeper understanding of why some social vulnerability patterns exist in the population, and how these might be addressed in disaster management or civil protection activities.
Further, authorities could also strengthen their ties with social society groups, forming new partnerships to reduce vulnerabilities. Cultural or religious organizations of migrants are a case in point. While being a migrant does not directly imply vulnerability, many immigrants (and especially non-legal) immigrants may be more vulnerable to hazard simply because of unfamiliarity with a new hazard environment, mechanisms used by local authorities for alerting or warning, or because of language barriers. The inability, or unwillingness to engage with and understand risk information or siren signals, for instance, hinders the ability of some migrants to prepare themselves prior to an event, or to react appropriately should a hazard transpire.
For the most part, migrants are reasonably evenly distributed within the urban society of Zürich, with few areas in the city where there are especially dense populations of specific cultural groups. This makes these people difficult to reach in an efficient way if disaster managers wish to do so. As such, identifying and collaborating with culturally significant organisations provides a means of reaching people with different language or cultural backgrounds.
Bibliography
ATSDR (2017) The Social Vulnerability Index (SVI). Available at: https://svi.cdc.gov/.
Bara, C. (2010a) ’Being Vulnerable in a Resilient Community?’, Proceedings of the First International Symposium on Societal Resilience, November 30 - December 2, 2020, Fairfax, Virginia, pp. 227-262.
Bara, C. (2010b) Social Vulnerability to Disaster. Factsheet, Center for Security Studies (CSS), ETH Zürich. Available: http://www.css.ethz.ch/content/dam/ethz/special-interest/gess/cis/center-for-securities-studies/pdfs/Factsheet-Social-Vulnerability.pdf
Barrett, G., Vanderplaat, M., Castellano Gonzalez, M. E., Ferreira Irmao, J., Godoy Ampuero, M. C., and Miranda Vera, C. E (2011) ‘Civic Networks and Community Resilience in Brazil, Canada, Chile, and Cuba’, Journal of Civil Society, 7(4), pp. 333–362.
Basu, R. and Samet, J. M. (2002) ‘Relation between elevated ambient temperature and mortality: A review of the epidemiologic evidence’, Epidemiologic Reviews, 24(2), pp. 190–202. doi: 10.1093/epirev/mxf007.
Bihari, M. and Ryan, R. (2012) ‘Influence of social capital on community preparedness for wildfires’, Landscape and Urban Planning, 106(3), pp. 253–261.
Birkmann, J., Cardona, O. D., Carreño, M. L., Barbat, A. H., Pelling, M., Schneiderbauer, S., Kienberger, S., Keiler, M., Alexander, D., Zell, P. and Welle, T. (2013) ‘Framing vulnerability, risk and societal responses: The MOVE framework’, Natural Hazards, 67(2), pp. 193– 211. doi: 10.1007/s11069-013-0558-5.
Bucher, H.-P. and Hofer, T. (2012) ‘Demografische Alterung im Kanton Zürich’, statistik.info, 2, Zürich, Switzerland. Available at: https://statistik.zh.ch/internet/ justiz_inneres/statistik/de/aktuell/mitteilungen/2012/alterung.html.
Caritas (2017) Factsheet - Armut in Zürich. Available at: https://www.caritas-zuerich.ch/dms/file/Mjk3Mg%3D%3D/Factsheet-ArmutKantonZuerich-2017.pdf
Carroll, M. S., Cohn, P.J., Sessholtz, D. and Higgins, L.L. (2005) ‘Fire as a Galvanising and Fragmenting Influence on Communities: The Case of the Rodeo- Chediski Fire’, Society and Natural Resources, 18, pp. 301–320.
Cutter, S. L., Boruff, B. J. and Shirley, W. L. (2003) ‘Social vulnerability to environmental hazards’, Social Science Quarterly, 84(2), pp. 242–261.
Cutter, S. L. and Emrich, C. T. (2006) ‘Moral Hazard, Social Catastrophe: The Changing Face of Vulnerability along the Hurricane Coasts’, The ANNALS of the American Academy of Political and Social Science, 604(1), pp. 102–112. doi: 10.1177/0002716205285515.
Cutter, S. L. and Finch, C. (2008) ‘Temporal and spatial changes in social vulnerability to natural hazards’, Proceedings of the National Academy of Sciences of the United States of America, 105(7), pp. 2301–6. doi: 10.1073/pnas.0710375105.
Eriksen, C. and Simon, G. (2017) ‘The Affluence–Vulnerability Interface: Intersecting scales of risk, privilege and disaster’, Environment and Planning A, 49(2), pp. 293–313. doi: 10.1177/0308518X16669511.
Fekete, A. and Hufschmidt, G. (2016) Atlas of Vulnerability and Resilience. Cologne & Bonn. Available at: http://docplayer.org/54819134-Verwundbarkeit-und-resilienz-atlas-vulnerability-and-resilience. html.
Freedman, D. (1999) ‘Ecological Inference and the Ecological Fallacy’, International Encyclopedia of the Social & Behavioral Sciences, 6(4027–4030), pp. 1–7. doi: 10.1073/pnas.96.19.10578.
Geenen, E. M. (2010) ‘Bevölkerungsverhalten und Moglichkeiten des Krisenmanagements und Katastrophenmanagements in multikulturellen Gesellschaften’ Forschung im Bevölkerungsschutz, 11, Bundesamt für Bevölkerungsschutz (BBK), Bonn. Available at: https://www.bbk.bund.de/SharedDocs/Downloads/BBK/DE/Publikationen/Publika-tionenForschung/FiB_Band11. pdf?__blob=publicationFile.
Grize, L., Huss, A., Thommen, O., Schindler, C. and Braun- Fahrländer, C. (2005) ‘Heat wave 2003 and mortality in Switzerland’, Swiss Medical Weekly, 135(13– 14), pp. 200–205. doi: smw-11009 [pii]\r2005/13/ smw-11009 [doi].
Haque, C. E. and Etkin, D. (2007) ‘People and community as constituent parts of hazards: the significance of societal dimensions in hazards analysis’, Natural Hazards. Kluwer Academic Publishers, 41(2), pp. 271–282. doi: 10.1007/s11069-006-9035-8.
Heye, C. and Leuthold, H. (2004) Segregation und Umzüge in der Stadt und Agglomeration Zürich. Fachstelle für interkulturelle Fragen (FiF). Available at: https:// www.stadt-zuerich.ch/content/dam/stzh/prd/ Deutsch/Statistik/Publikationsdatenbank/spezial_ publikationen/Segregation_und_Umzuege.pdf
Kanton Zürich (2013) Einkommensverteilung wie vor zwanzig Jahren. Die Verteilung der Einkommen von 1991 bis 2010. statistik.info,11. Available at: https://statistik.zh.ch/content/dam/justiz_innern/statistik/Publikationen/statistik_info/ si_2013_11_verteilung_einkommen.pdf.
Kanton Zürich (2017) Alterspyramide Kanton Zürich 1995– 2040. Statistical Office. Available at: https://statistik.zh.ch/internet/justiz_inneres/statistik/de/interaktives/alterspyramide.html
Maduz, L., Roth, F., Prior, T., and Wolf, A. (forthcoming) Persönliche Notfallvorsorge Kenntnisse und Informationsbedürfnisse der Schweizer Bevölkerung (2017). Risk and Resilience Report, Center for Security Studies (CSS), ETH Zürich.
Pauver, B., Twigg, J. and Sagramola, S. (2016) Major Hazards, Migrants, Asylum Seekers and Refugees: Their Inclusion in Disaster Preparedness and Response, Council of Europe. Available at: https://rm.coe. int/16806acd58.
Prior, T., Roth, F., Maduz, L. and Scafetti, F. (2017) Mapping Social Vulnerability in Switzerland: A pilot study on Flooding in Zürich. Risk and Resilience Report, Center for Security Studies (CSS), ETH Zürich. Available: https://www.ethz.ch/content/dam/ethz/special-interest/gess/cis/center-for-securities-studies/ pdfs/RR-Reports-2017-Social%20Vulnerability.pdf.
Prior, T. and Eriksen, C. (2013) ‘Wildfire preparedness, community cohesion and social–ecological systems’, Global Environmental Change, 23(6), pp. 1575–1586. doi: http://dx.doi.org/10.1016/j. gloenvcha.2013.09.016.
Quarantelli, E. L. (1992) ‘The Importance of Thinking of Disasters as Social Phenomena’, Disaster Research Center Preliminary Paper, 184. Available at: http:// udspace.udel.edu/handle/19716/572.
Reardon, T. and Matlon, P. (1985) ‘Seasonal Food Insecurity and Vulnerability in Drought-Affected Regions of Burkina Faso’, World Health, pp. 118–136.
Rufat, S. (2013) ‘Spectroscopy of Urban Vulnerability’, Annals of the Association of American Geographers, 103(3), pp. 505–525. doi: 10.1080/00045608.2012.702485.
Roth, F., Eriksen, C., and Prior, T. (2017) Understanding the root causes of natural disasters. The Conversation, 27.06.2017. Available at: https://theconversation. com/understanding-the-root-causes-of-natural-disasters-80017
Stadt Zürich (2017a) Anteil ausländische Bevölkerung. Presidential Department. Available at: https:// www.stadt-zuerich.ch/prd/de/index/statistik/themen/bevoelkerung/nationalitaet-einbuergerung-sprache/anteil-auslaendische-bevoelkerung.html.
Stadt Zürich (2017b) Mietpreisindex. Presidential Department. Available a: https://www.stadt-zuerich.ch/ prd/de/index/statistik/themen/bauen-wohnen/ mietpreise/mietpreisindex/mietpreisindex.html.
Tierney, K. and Oliver-Smith, A. (2012) ‘Social Dimensions of Disaster Recovery’, International Journal of Mass Emergencies and Disasters, 30(2), pp. 123–146. doi: 10.1017/CBO9781107415324.004.
UNISDR (The United Nations International Strategy for Disaster Reduction) (2015) Indigenous knowledge key for DRR. Available at: https://www.unisdr.org/ archive/45404.
Vicedo-Cabrera, A. M., Ragettli, M.S., Schindler, C. and Röösli, M. (2016) ‘Excess mortality during the warm summer of 2015 in Switzerland’, Swiss Medical Weekly, 146, w14379. http://doi.org/10.4414/s’, Swiss medical weekly, 146, p. w14379. doi: 10.4414/ smw.2016.14379.
Wisner, B. (1998) ‘Marginality and vulnerability: Why the homeless of Tokyo don’t “count” in disaster preparations.’, Applied Geography, 18(1), pp. 25–33.
Yoon, D. K. (2012) ‘Assessment of social vulnerability to natural disasters: a comparative study’, Natural Hazards, 63(2), pp. 823–843. doi: 10.1007/ s11069-012-0189-2.
Zürich Tourismus (2013) Zürcher Tourismus in Zahlen: Zahlen & Fakten 2013. Available at: http://www. ztextra.ch/files/?id=62688.
Notes
1 The Canton of Zürich has developed a pandemic risk map based on scenarios, but this was not available at the time of drafting.
*To see the appendices for this publication, please view the pdf version of this report here.
About the Authors
Florian Roth is a Senior Researcher with the Risk and Resilience Team at the Center for Security Studies (CSS). His research interests centre on risk and crisis communication in different domains, including disaster management and international security governance.
Tim Prior is head of the Risk and Resilience Research Team at the CSS. His research has focused on risk and decision making under uncertainty, particularly in relation to individual, community and organizational preparation and response to environmental risk.
Linda Maduz is a researcher with the Risk & Resilience Team at the CSS. Her research interests center on how political institutions and governance systems develop in a context of changing social, technical and environmental risks.
Anna Wolf is a research assistant at the CSS.
For more information on issues and events that shape our world, please visit the CSS Blog Network or browse our Digital Library.